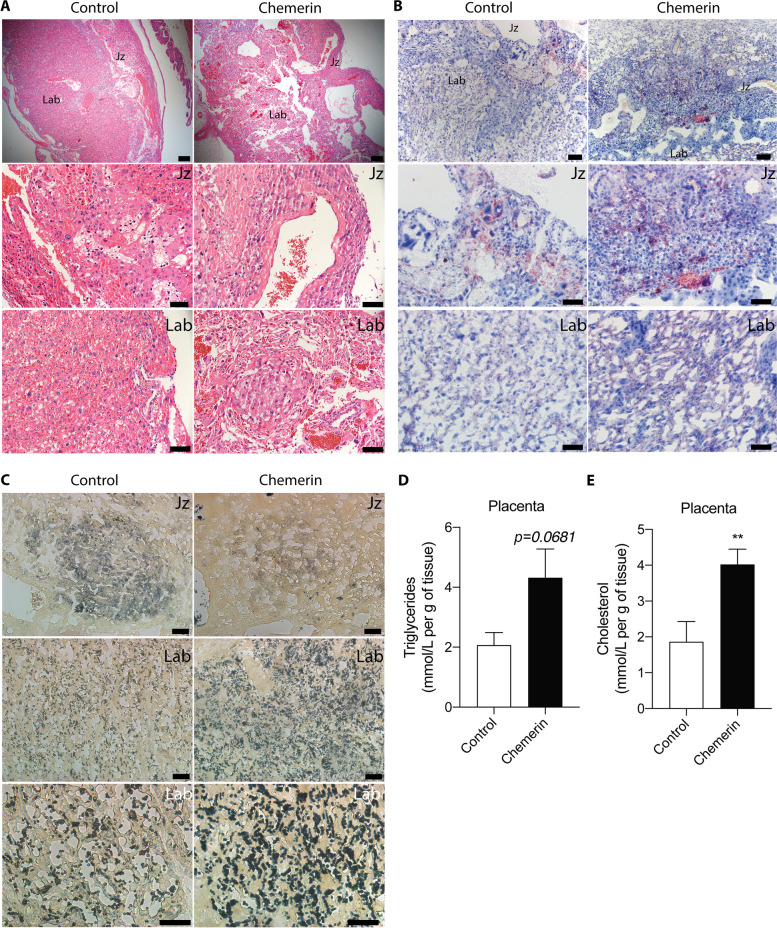
Fig. 2.
Effect of overexpression of trophoblast-specific chemerin on mouse placental lipid levels. Representative placental images of (A) hematoxylin and eosin staining (H&E, top panel: scale bar = 200 μm; Jz and Lab images: scale bar = 50 μm), (B) Oil Red O staining (top panel: scale bar = 200 μm; Jz and Lab images: scale bar = 50 μm), and (C) PPD staining (Bottom panel of Lab: scale bar = 20 μm; Jz and Lab images: scale bar = 50 μm), respectively. (D and E) Levels of (D) placental triglycerides and (E) cholesterol levels, respectively. n = 5, **P < 0.01. Jz, junctional zone; Lab, labyrinth zone; PPD, paraphenylenediamine

