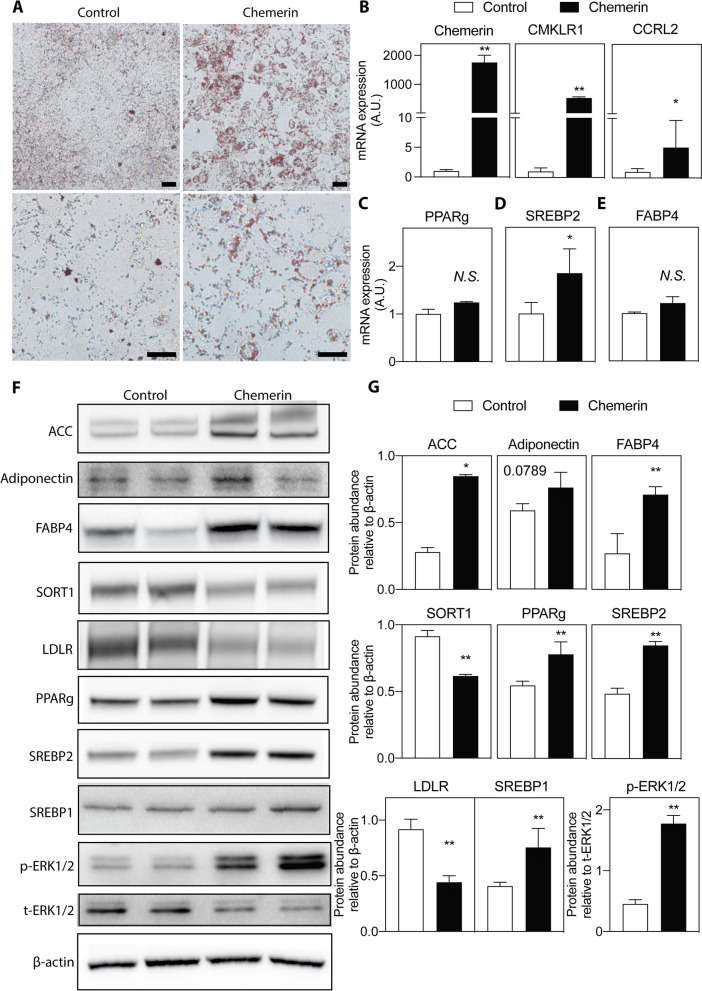
Fig. 4.
Effect of chemerin overexpression on lipid metabolism in HTR-8/SVneo cells. A Representative images of Oil Red O staining of HTR-8/SVneo cells (up panel: scale bar = 200 μm; Bottom panel: scale bar = 50 μm). The mRNA expression of (B) Chemerin and its receptors (GRP1 was not detected), (C) PPARg, (D) SREBP2, and (E) FABP4 in HTR-8/SVneo cells. n = 3, *P < 0.05. (F) Analysis of lipid metabolism in HTR-8/SVneo cells by using Western blot. G The protein abundance was quantified and normalized to the level of β-actin or total ERK1/2. n = 3 per group; *P < 0.05, **P < 0.01

