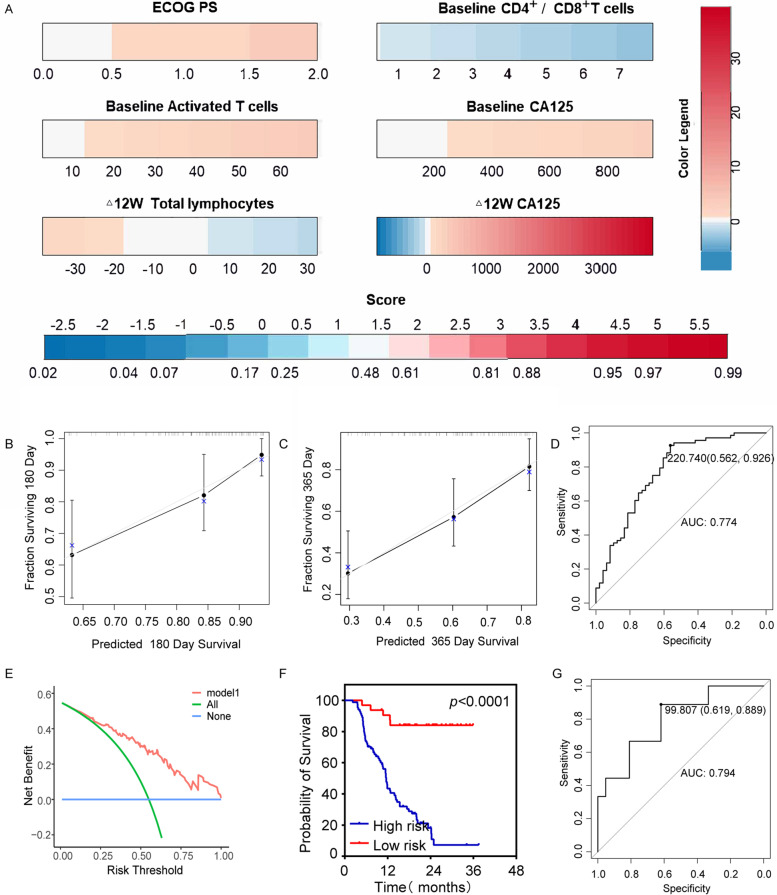
Fig. 4.
Nomogram model of disease progression. A PFS nomogram based on the multivariate model, including ECOG PS, Baseline Activated T cells, Baseline CD4+/CD8 + T cells, Baseline CA125, Δ12W Total lymphocytes andΔ12W CA125. B and C The 180- and 365- days PFS calibration curves. D ROC curves in the training set. E DCA of the nomogram. Model 1(DCA curves for PFS in the training set). F Kaplan-Meier curves of nomogram in training set. G ROC curves in the validation set. PFS, progression-free survival; ECOG PS, Eastern Cooperative Oncology Group performance status; DCA, decision curve analysis; ROC, receiver operating characteristic curve; AUC, area under the curve

