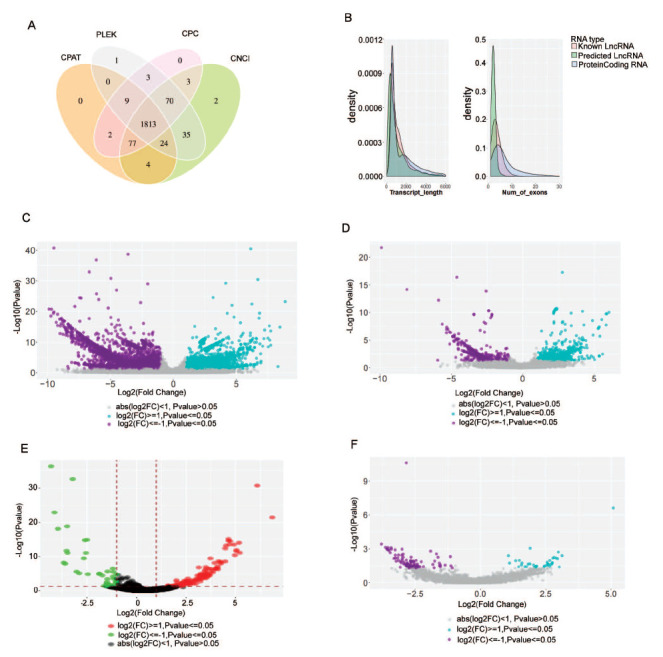
Fig. (1).

Differentially expressed mRNA, miRNA, circRNA and lncRNA in PARPi-resistant ovarian cancer cells and untreated ovarian cancer cells. (A) The venn diagram of the noncoding transcripts identified by. The number in the circle represents the number of lncRNA predicted by different methods. The intersection of the four methods was shown as the final lncRNA identified. (B) The density plots of distribution of protein-coding RNA, known lncRNA and predicted lncRNA. The number of The volcano plot of differentially expressed mRNAs(C), lncRNAs (D), circRNAs (E) and miRNAs (F). Green and red dots represent downregulated and upregulated mRNAs and ncRNAs, respectively.
