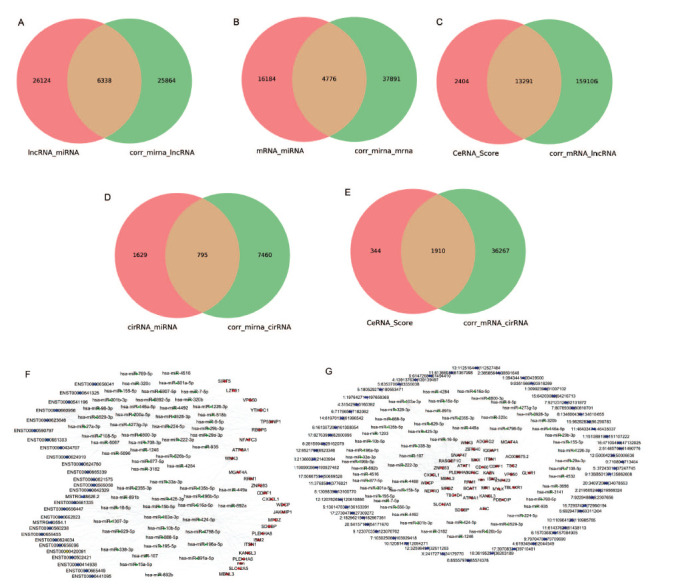
Fig. (3).

PARPi resistance-related ceRNA network. A. Venn diagram of lncRNA-miRNA shows the filtered lncRNA-target. The filtered lncRNA-miRNA were identified by miRnada and Pearson correlation coefficient analysis. B. Venn diagram of miRNA-mRNA shows the filtered miRNA-target. MiRnada and Pearson correlation coefficient analysis identified the filtered miRNA-mRNA. C. Venn diagram of ceRNA and filtered lncRNA-mRNA. The ceRNAs were filtered through Pearson correlation coefficient analysis. D. Venn diagram of circRNA-miRNA show the filtered circRNA-target. The filtered circRNA-miRNA were identified by miRnada and Pearson correlation coefficient analysis. E. Venn diagram of ceRNA and filtered circRNA-mRNA. The ceRNAs were filtered through Pearson correlation coefficient analysis. F. lncRNA-miRNA-mRNA ceRNA network. G. circRNA-miRNA-mRNA ceRNA network.
