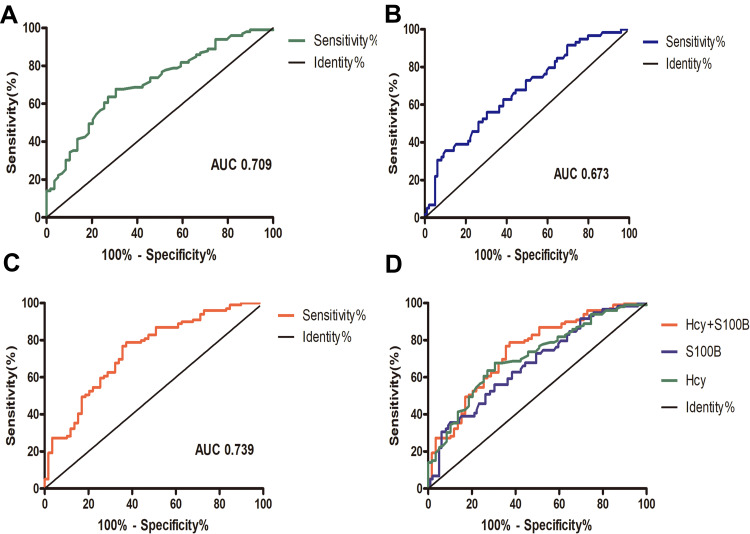
Figure 4.
Receiver operating characteristic (ROC) curves for predicting cognitive impairment after PIS. ROC curve of Hcy (AUC = 0.709, sensitivity = 67.7%, specificity = 66.1%) (A), S100B protein (AUC = 0.673, sensitivity = 69.7%, specificity = 55.9%) (B), and combined Hcy and S100B protein (AUC = 0.739, sensitivity = 78.8%, specificity = 62.7%) (C). (D) Combination diagram of ROC curves.

