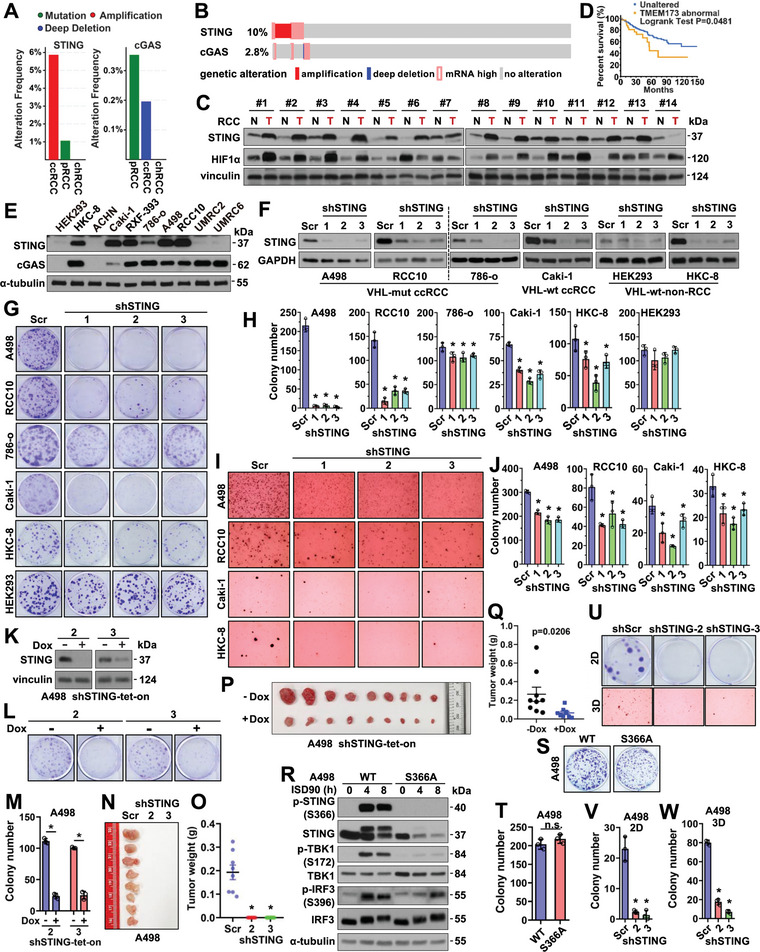
Figure 1.

Depletion of STING reduces RCC cell growth independent of innate immunity. A) Genetic alteration frequency (mutated, amplified, and deep deleted cases/total cases) of STING or cGAS in indicated RCC patients from the TCGA PanCancer Atlas database. B) Oncoprint showing genetic alteration of STING and cGAS in ccRCC patients from the TCGA PanCancer Atlas database. C) Immuno‐blot (IB) analyses of tumor lysates from normal‐adjacent tissues (N) or RCC tumors (T). D) A Kaplan‐Meier plot showing increased STING expression is associated with worse patient survival in ccRCC. E) IB analyses of WCL derived from indicated RCC cells. F) IB analyses of control and STING‐depleted RCC cells. G) Representative images for 2D colony formation assays using cells from F. H) Quantification of (G). Error bars were calculated as mean+/‐SD, n = 3. *p < 0.05 (one‐way ANOVA test). I, Representative images for 3D soft agar growth assays using cells from (F). J) Quantification of I. Error bars were calculated as mean+/‐SD, n = 3. *p < 0.05 (one‐way ANOVA test). K) IB analysis of WCL derived from shSTING‐tet‐on A498 cells treated with or without 1 µg ml−1 doxycycline. L) Representative images for 2D colony formation from K. M) quantification of L. N,O) Mouse xenograft experiments were performed with indicated A498 cells. 66 days post‐injection, mice were sacrificed, and tumors were dissected (N) and weighed (O). n = 8. *p<0.05 (one‐way ANOVA test). P,Q) Mouse xenograft experiments were performed with teton‐shSTING‐2 A498 cells. Doxycycline was administrated to mice at day 15 post‐injection. 39 days post‐injection, mice were sacrificed, and tumors were dissected (P) and weighed (Q). n = 9. *p<0.05 (one‐way ANOVA test). R) IB analyses of WCL derived from WT or S366A‐knockin A498 cells treated with 5 µg mL−1 ISD90 for indicated periods. S,U) Representative images for 2D colony formation or 3D soft agar growth assays using indicated cells. T,V,W) Quantification of S, U. Error bars were calculated as mean+/‐SD, n = 3. *p < 0.05 (one‐way ANOVA test).
