Figure 2.

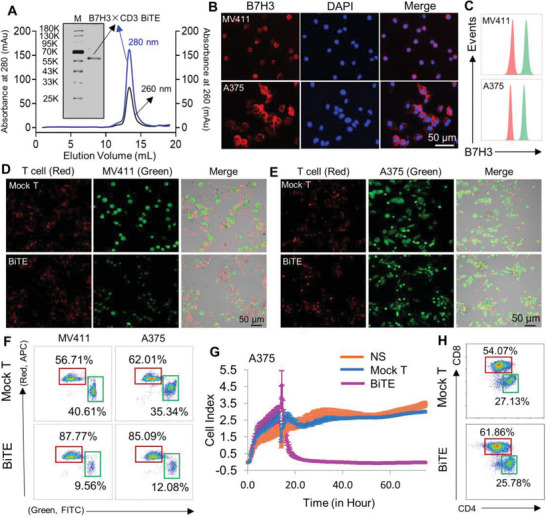
Construction and cytotoxicity of anti‐B7H3×CD3 BiTE in vitro. A) SDS PAGE and gel filtration chromatograph of anti‐B7H3×CD3 BiTE. M: marker. B,C) Immunofluorescence staining and FACS analysis of the expression of B7H3 in MV411 and A375 cells. Scale bars, 50 µm. Cells were incubated with human B7H3 antibody (red) or its corresponding isotype control (green). D–F) The morphology and result of tumor cell lysis were analyzed using confocal microscopy and FACS respectively. T cells with the BiTE (BiTE) and cells without BiTE (Mock T) are experimental and control groups, respectively. Scale bars, 50 µm. G) Target cell (A375) survival curves were recorded by the xCELLigence real‐time cell analyzer. H) Dot plot diagram of FACS showing the CD4+ and CD8+ percentages of human T cells after 5 µg mL−1 B7H3×CD3 BiTE treatment for 24 h.
