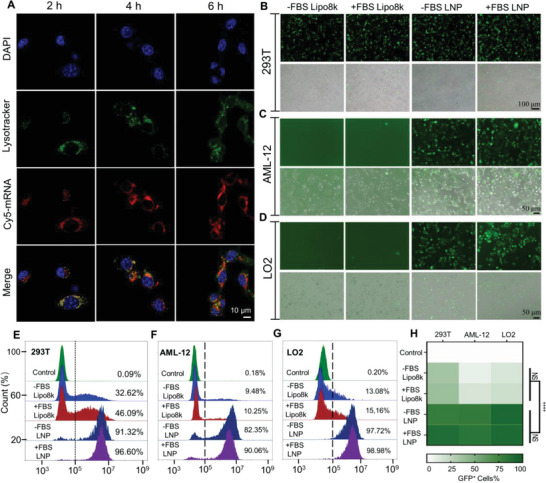
Figure 4.

Subcellular colocalization and transfection efficiency. A) CLSM images show the lysosome escape of LNP@ CY5‐mRNA in AML12 cells after 2, 4, and 6 h of incubation. The bar represents 10 µm. B–D) Graphs illustrating B) GFP expression in 293T cell lines, C) mouse normal hepatic cells (AML‐12), and D) human normal liver cells (LO2) under the indicated conditions. Scale bars, 100 and 50 µm, respectively. E–H) FACS and quantitative analysis of GFP expression in the three types of cells mentioned above. NS: no significance, ****p < 0.0001
