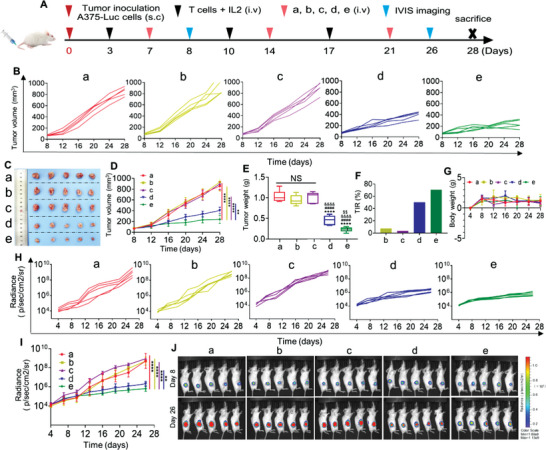
Figure 7.

In vivo antitumor effects of BiTE mRNA‐LNPs in human melanoma subcutaneous tumor xenograft models. A) Schematic diagram of the immunotherapy regimen. B) Tumor growth of each mouse in different groups. C) Photographs of A375 tumor‐bearing mouse on day 28 after the indicated treatments. D–G) Growth of D) tumor volume, E) tumor weight, F) the tumor inhibition rate, and G) body weight change in different groups of mouse. n = 5.**p < 0.01 and ****p < 0.0001 compared to (e) at 28 days. ****p < 0.0001 versus the group of (a). #### p < 0.0001 versus the group of (b). &&&& p < 0.0001 versus the group of (c). $$ p < 0.001 versus the group of (d). H,I) Tumor individual or total flux data (in p/s) were calculated using living image software. n = 5.**p < 0.01 and ****p < 0.0001 compared to (e) at 26 days. J) The representative tumor growth was shown in vivo by bioluminescence imaging using IVIS 200 at 8 and 26 days after implantation. Laser power density, mean ± SD, 2 W cm−2 (n = 5). (a) Normal saline + T cell, (b) 22 mg kg−1 IC8‐LNPs + T cell, (c) 1.5 mg kg−1 BiTE mRNA + T cell, (d) 6 mg kg−1 BiTE + T cell, (e) 1.5 mg kg−1 BiTE mRNA‐LNPs + T cell.
