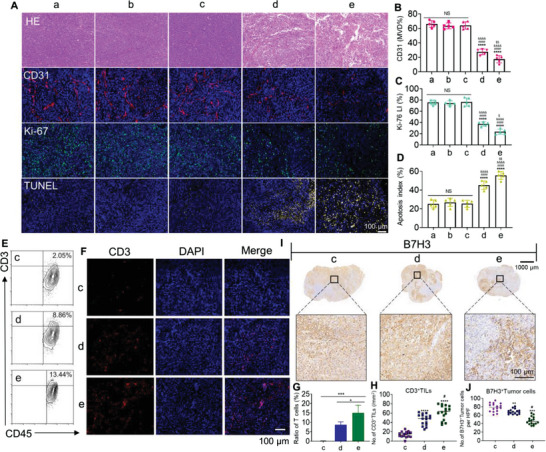
Figure 8.

In vivo lymphocyte infiltrate and histology of tumors assessment in human melanoma subcutaneous tumor models. A) H&E staining, CD31, Ki‐67, and TUNEL immunofluorescent staining of tumor slices. Scale bars, 100 µm. B–D) Microvessel density (MVD), mean Ki‐67 LI, and mean apoptotic index in each group. ****p < 0.0001 versus the group of (a). #### p < 0.0001 versus the group of (b). &&&& p < 0.0001 versus the group of (c). $ p < 0.05 and $$ p < 0.001 versus the group of (d). n = 5. E,F) Tumor‐infiltrating T cells (CD3+) were quantified and determined by using FACS and fluorescence IHC. Scale bars, 100 µm. G,H) CD3+ TILs from intact tumors from the (c), (d), and (e) groups were quantified by FACS and IHC. ****p < 0.0001 versus the group of (c). *p < 0.05 and # p < 0.05 versus the group of (d). I,J) B7H3‐expressing tumor cells were quantified by IHC in three consecutive tumor sections. Top, representative IHC images, Scale bars, 1000 µm. Arrowheads indicate positive staining. Scale bars, 100 µm. **p < 0.01 and ***p < 0.001 versus the group of (c). # p < 0.05 versus the group of (d). (a) Normal saline + T cell, (b) 22 mg kg−1 IC8‐LNP + T cell, (c) 1.5 mg kg−1 BiTE mRNA + T cell, (d) 6 mg kg−1 BiTE + T cell, (e) 1.5 mg kg−1 LNP@BiTE‐mRNA + T cell.
