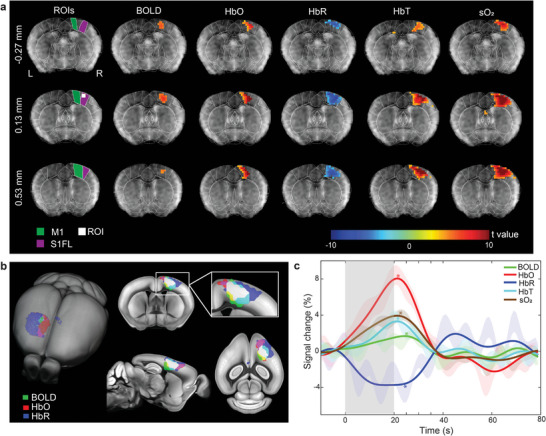
Figure 2.

Representative stimulus‐evoked responses recorded by MROT. a) Multi‐slice (volumetric) activations maps of the BOLD, HbO, HbR, HbT, and sO2 hemodynamic components overlaid to the anatomical T1‐weighted image of the brain. Statistically significant responses, as resolved by the general linear model of the SPM12 software with one‐sided t‐tests, were observed in the S1FL and M1 brain areas. The brain regions in the coronal slices were segmented based on the Allen Mouse Brain Common Coordinate Framework (CCF). The left side of the image corresponds to the left hemisphere. b) Superposition of the BOLD, HbO, and HbR activation maps onto the mouse brain atlas. The white color indicates the overlapping region of the three components. c) Averaged fractional signal intensity changes of the hemodynamic components following the sensory stimulation. The activation time curve for each component was computed from a 0.4 × 0.4 × 0.4 mm3 region of interest located in the contralateral S1FL brain area, as labeled in panel (a). Time‐to‐peak (TTP) values are indicated with * for different components. Shaded regions show standard error of mean (SEM) across all the stimulation sequences in different animals. The grey bar indicates the stimulation period.
