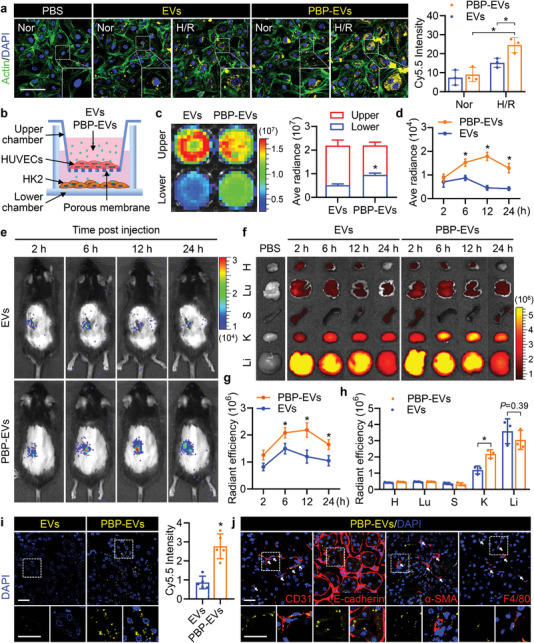
Figure 3.

Endothelial cell targeting capacity of PBP‐EVs. a) H/R‐injured HUVECs (Alexa Fluor 488‐labeled phalloidin, green, actin) demonstrated enhanced internalization of PBP‐EVs (Cy5.5, yellow) in vitro. Scale bars, 100 µm, n = 3. b) Diagram of a modified Transwell assay to detect penetration of EVs or PBP‐EVs into an H/R‐injured endothelial monolayer barrier (endothelial cells, HUVECs) and infiltration into renal parenchyma cells (tubular epithelial cells, HK2). c) Gluc signals of EVs and PBP‐EVs in the upper and lower chambers of the modified Transwell system were evaluated by BLI, n = 3. d) Quantitative analysis of EVs and PBP‐EVs accumulated in the injured kidney by Gluc imaging. The average radiance of the Gluc signals was expressed as photons/s/cm2/steradian, n = 3. e) The renal targeting ability of PBP‐EVs was traced in real time in vivo by Gluc imaging. f) Organ distributions of EVs and PBP‐EVs in severe IRI mice were detected by Cy5.5 radiant efficiency after a single intravenous injection of 100 µg EVs or PBP‐EVs. H: heart, Lu: lung, S: spleen, K: kidney, Li: liver. g) Quantitative analysis of EVs and PBP‐EVs accumulated in the injured kidney by Cy5.5 signals at 2, 6, 12, and 24 h after injection. The radiant efficiency of Cy5.5 was expressed as [photons/s/cm2/steradian]/[µW cm−2], n = 3. h) Quantitative analysis of Cy5.5 radiances in the indicated organs of severe IRI mice at 12 h after injection. The radiant efficiency of Cy5.5 was expressed as [photons/s/cm2/steradian]/[µW cm−2], n = 3. H: heart, Lu: lung, S: spleen, K: kidney, Li: liver. i) Representative images and quantitative analysis of EVs and PBP‐EVs (Cy5.5, yellow) accumulated in injured renal tissues 12 h postinjection. Scale bar, 25 µm, n = 3. j) Representative images showing the accumulation of PBP‐EVs (Cy5.5, yellow) in endothelial cells (CD31+, red), tubular epithelial cells (E‐cadherin+, red), fibroblasts (α‐SMA+, red), and macrophages (F4/80+, red) in injured renal tissues 12 h postinjection. The bottom was a higher magnification of the boxed region. Scale bar, 25 µm. All data are expressed as the mean ± s.d. For a), c), d), and g), statistical analysis was performed using two‐way ANOVA with Tukey's multiple comparison tests. For h) and i), statistical analysis was performed using two‐tailed unpaired Student's t‐tests. *P < 0.05. The nuclei were counterstained with DAPI (blue).
