
Figure 6.
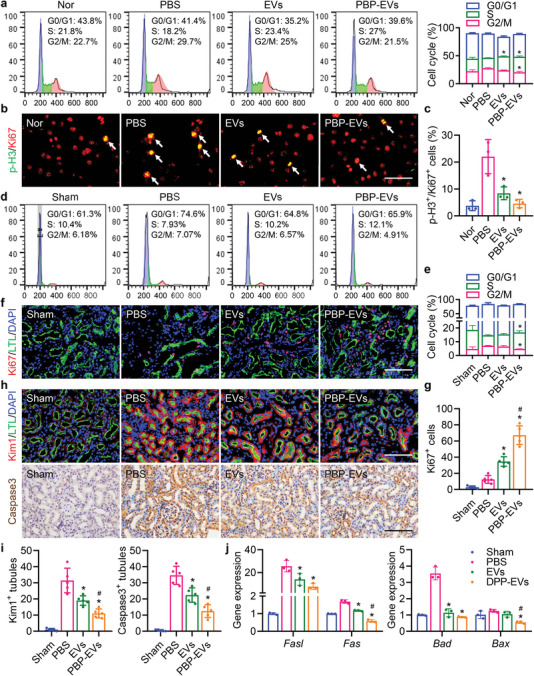
PBP‐EVs ameliorate maladaptive repair of tubular epithelial cells. a) The cell cycle of H/R‐injured HK2 cells was assessed by PI staining after administration of EVs or PBP‐EVs for 24 h. Normal HK2 cells served as a control, n = 3. b) Immunofluorescence of Ki67 (red) and p‐H3 (green) in H/R‐injured HK2 cells treated with EVs or PBP‐EVs for 24 h. Scale bar, 50 µm. c) Percentage of proliferating HK2 (Ki67+) cells that were in the G2/M phase (p‐H3+) of the cell cycle after H/R injury with administration of EVs or PBP‐EVs, n = 3. d) Cell cycles of TECs isolated from injured kidneys on day 3 postsevere IRI were analyzed by PI staining. Cells isolated from kidneys with sham operation served as a control. e) Percentage of TECs isolated from kidneys according to the cell cycle distribution, n = 3. f) Immunofluorescence of Ki67 (red) in renal tissues (FITC‐labeled LTL, green, proximal tubules) on day 3 postsevere IRI. Scale bar, 100 µm. g) Quantification of Ki67+ cells in renal immunofluorescence images, n = 5. h) Immunofluorescence of Kim1 (red, top row) and caspase3 (brown, bottom row) in renal tissues at day 3 postsevere IRI. Scale bar, 100 µm. i) Quantitative analysis of Kim1+ renal tubules and caspase3+ renal tubules in immunofluorescence images. n = 5. j) Expression of apoptosis‐related genes (Fasl, Fas, Bad, and Bax) in renal tissues was detected by real‐time qPCR on day 3 postsevere IRI. The renal tissues subjected to the sham operation served as the control, n = 3. All data are expressed as the mean ± s.d. Statistical analysis was performed using one‐way ANOVA with Tukey's multiple comparison tests. *P < 0.05 versus PBS, # P < 0.05 versus EVs. The nuclei were counterstained with DAPI (blue).