
Figure 2.
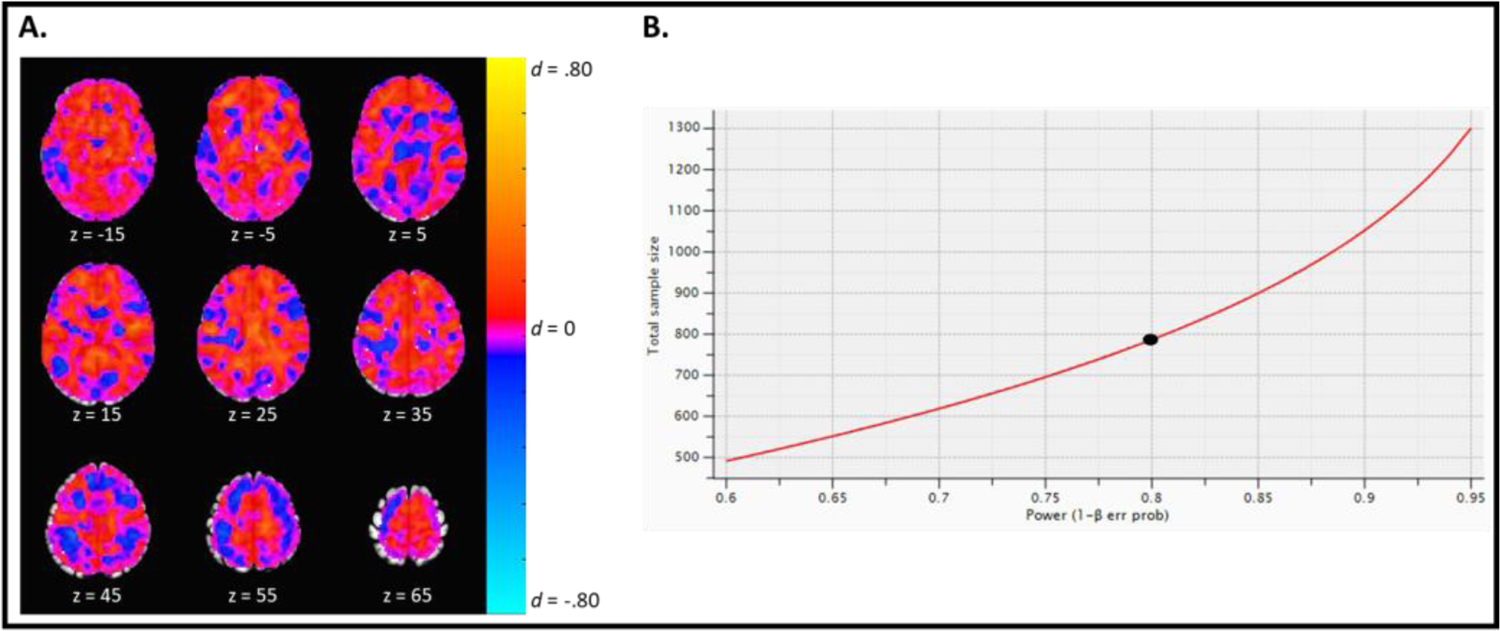
Magnitude of the effect of group on the cognitive reappraisal contrast. A. An unthresholded effect size map depicting the magnitude of the effect of group during the decrease-negative relative to look-negative contrast. Warmer colors (e.g., orange) indicate a greater effect of group during the decrease-negative cue, while cool colors (e.g., blue) indicate a greater effect of group during the look-negative cue. As can be seen, family history group does not appear to have a meaningful effect on cognitive reappraisal capacity as the majority of brain regions have small effect sizes d < .20. B. The graph depicts the sample sizes needed to detect a small effect of d = .20 at various power levels. To be adequately powered (.80) to detect a meaningful yet small effect (d = .20) of group on cognitive reappraisal capacity, we would need a sample of 788 participants (indicated by the black circle).