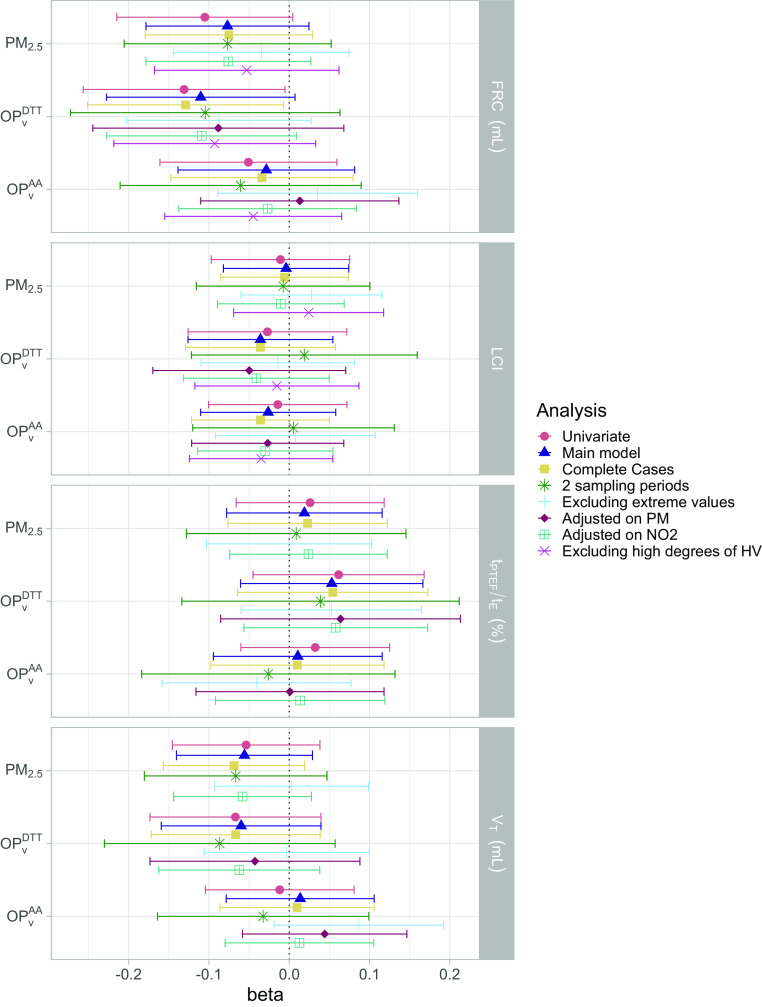
Figure 3.
Association between personal exposure to , , and during pregnancy and lung function parameters measured at 6 wk in the univariate and multiple linear models and in the sensitivity analyses. Outcomes and exposures were scaled by their IQR. See Tables S4 and S6 for corresponding numeric data. Whiskers represent the 95% confidence interval around the estimate. The main model was adjusted on child’s height, weight, sex, age, season of sampling, breastfeeding, environmental tobacco smoke, maternal age and BMI before pregnancy, parental level of education, parental history of rhinitis, and mean temperature during pregnancy. In addition, “2 sampling periods” are the analyses reduced to the children that had 2 wk of prenatal measurements of air pollution (63%–66% of the population); “Excluding extreme values” are the analyses excluding the exposures and outcomes below the first percentile and above the 99th (exclusion of approximately 5% of the population); “Adjusted on PM” corresponds to adding personal exposure to in the set of confounders, “Adjusted on ” corresponds to adding personal exposure to in the set of confounders, and the last analyses were performed excluding children that had the highest hypoventilation degree during the nitrogen multiple breath washout test (excluding 25% of the population). Note: AA, ascorbic acid; BMI, body mass index; DTT, dithiothreitol; FRC, functional residual capacity; IQR, interquartile range; LCI, lung clearance index; , volume-normalized oxidative potential measured by the AA assay (); , volume-normalized oxidative potential measured by the DTT assay (nmol); PM, particulate matter; , PM with an aerodynamic diameter (); , ratio of time to peak tidal expiratory flow to expiratory time; , tidal volume.

