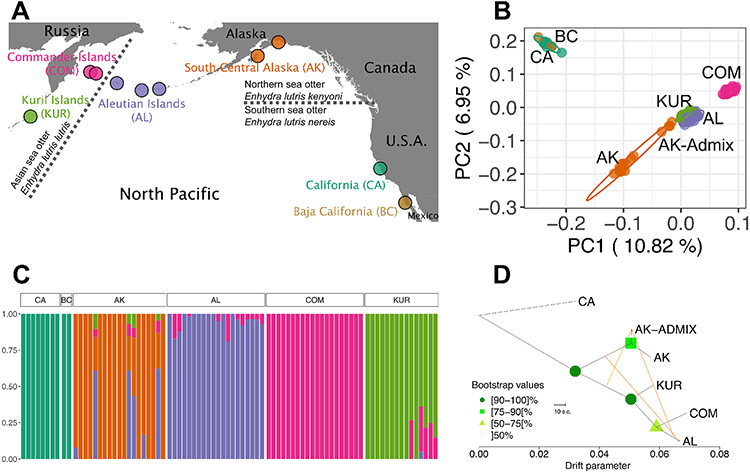
Figure 1. Sea Otter Population Structure Mirrors Historic Distribution.
A) Locations of sea otter samples used in this study. Sea otters were sampled from the Kuril Islands (KUR, n = 13), Commander Islands (COM, n = 45), Aleutian Islands (AL, consisting of Attu, Amchitka and Adak Islands, n = 21), south central Alaska (AK, n = 19), California (CA, n = 7), and Baja California (BC, n = 2). Dashed lines indicate the previously-designated subspecies boundaries between southern, northern and Asian sea otters. See Figure S1 for finer-scale sampling location maps, Supplemental Methods for sample information, and Tables S1 and S3 for sample and coverage details.
B) Principal components analysis of modern sea otter samples. Multivariate t-distribution 95% data ellipses are shown. See Figure S3A-C for PCA analyses of the northern and Asian populations without California which provide greater resolution of their population structure.
C) fastSTRUCTURE analysis of the samples with the number of clusters (K) = 5. See Figure S3F for additional values of K.
D) Bootstrapped Treemix analysis showing drift between populations, with migration events shown as orange lines. California was set as the root. Admixed south central Alaskan individuals are separated in the analysis (AK-Admix) from the non-admixed (AK). Baja California was excluded as it appears to be an expansion of the California population, rather than a distinct population. Treemix residuals are shown in Figure S3G.

