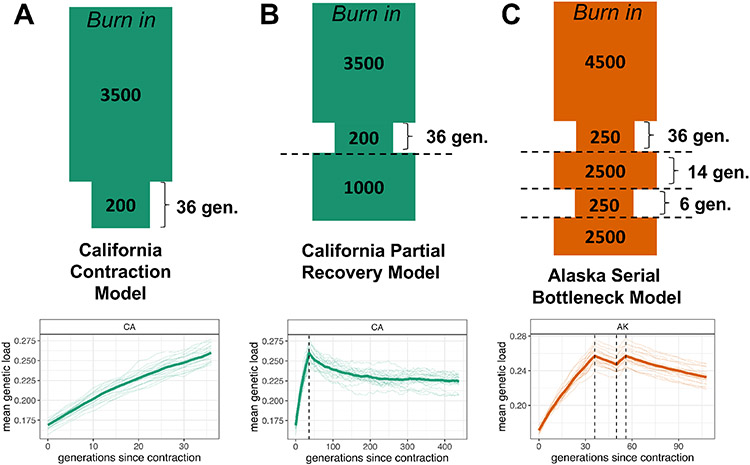
Figure 4. Recessive Genetic Load is Predicted to Increase During Decline and Persist after Recovery.
A) Forward-in-time Wright-Fisher simulations of genetic load (reduction in fitness due to deleterious variation) under the demographic model of recent population decline we inferred for the California sea otter population. The demographic model is shown above, with sizes in diploid individuals and times in generations. The simulation results below the model diagram show an increase in genetic load during the inferred population contraction (contraction occurs at generation 0). The thick line represents the mean of 20 simulation replicates, with individual replicates as faint lines. The contraction duration was increased from 35 to 36 generations to accommodate sampling of load every even-numbered generation in the simulation framework.
B) Simulations of genetic load under a model of partial recovery for the California population in which the contraction modeled in (A) is followed by a partial recovery to an effective size of 1000 individuals. The simulation results below the model are as described in (A). The partial recovery occurs at the dashed line.
C) A model of serial declines in the south central Alaska population, showing the possible impacts of post-fur trade events such as the Exxon Valdez oil spill or orca predation. The simulation results below the model are as described in (A). The first population contraction occurring at generation 0, followed by a brief recovery (starting at the first dashed line), then another rapid contraction and partial recovery (second and third dashed lines).
Results based on alternative distributions of dominance and selection coefficients are shown in Figure S6C-E.

