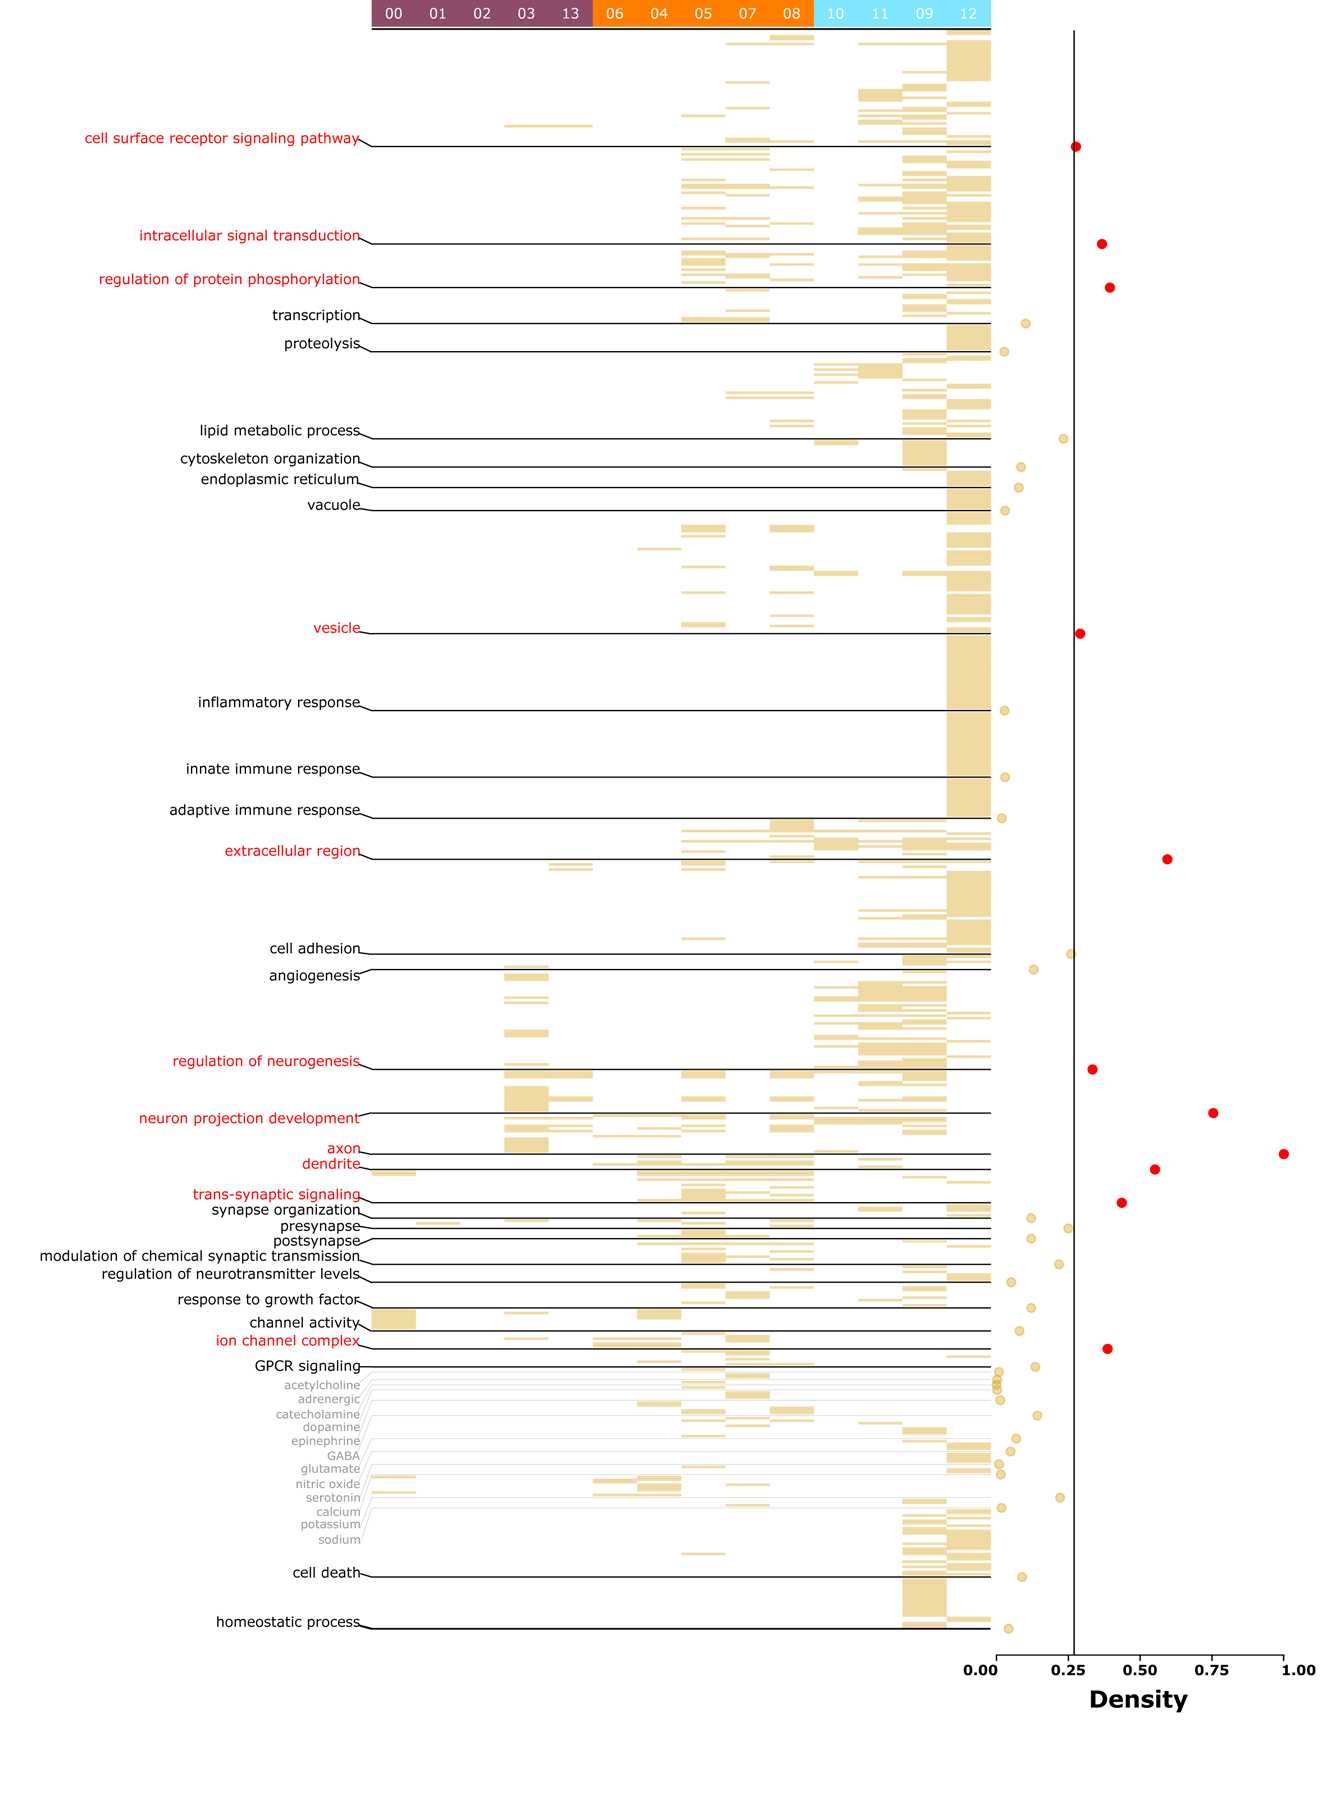
Figure 2. Functional analysis of cell types in the control state.

Heatmap of significant (q-value <0.05) pathways for each cell type. Cell type cluster numbers are provided at the top, with PN clusters in purple (left), interneuron clusters in orange (middle), and non-neuronal clusters in blue (right). Pathways are organized by functional themes provided at the left. Densities for each theme are provided at the right, with higher indices (in red, > 75th percentile) indicating more common (housekeeping) processes and lower indices (in yellow, <25th percentile) indicating more unique (salient) processes. The vertical line at density = 0.26 represents the average density across all themes. See Supplementary Table 6 for a complete list of cell-specific pathways.
