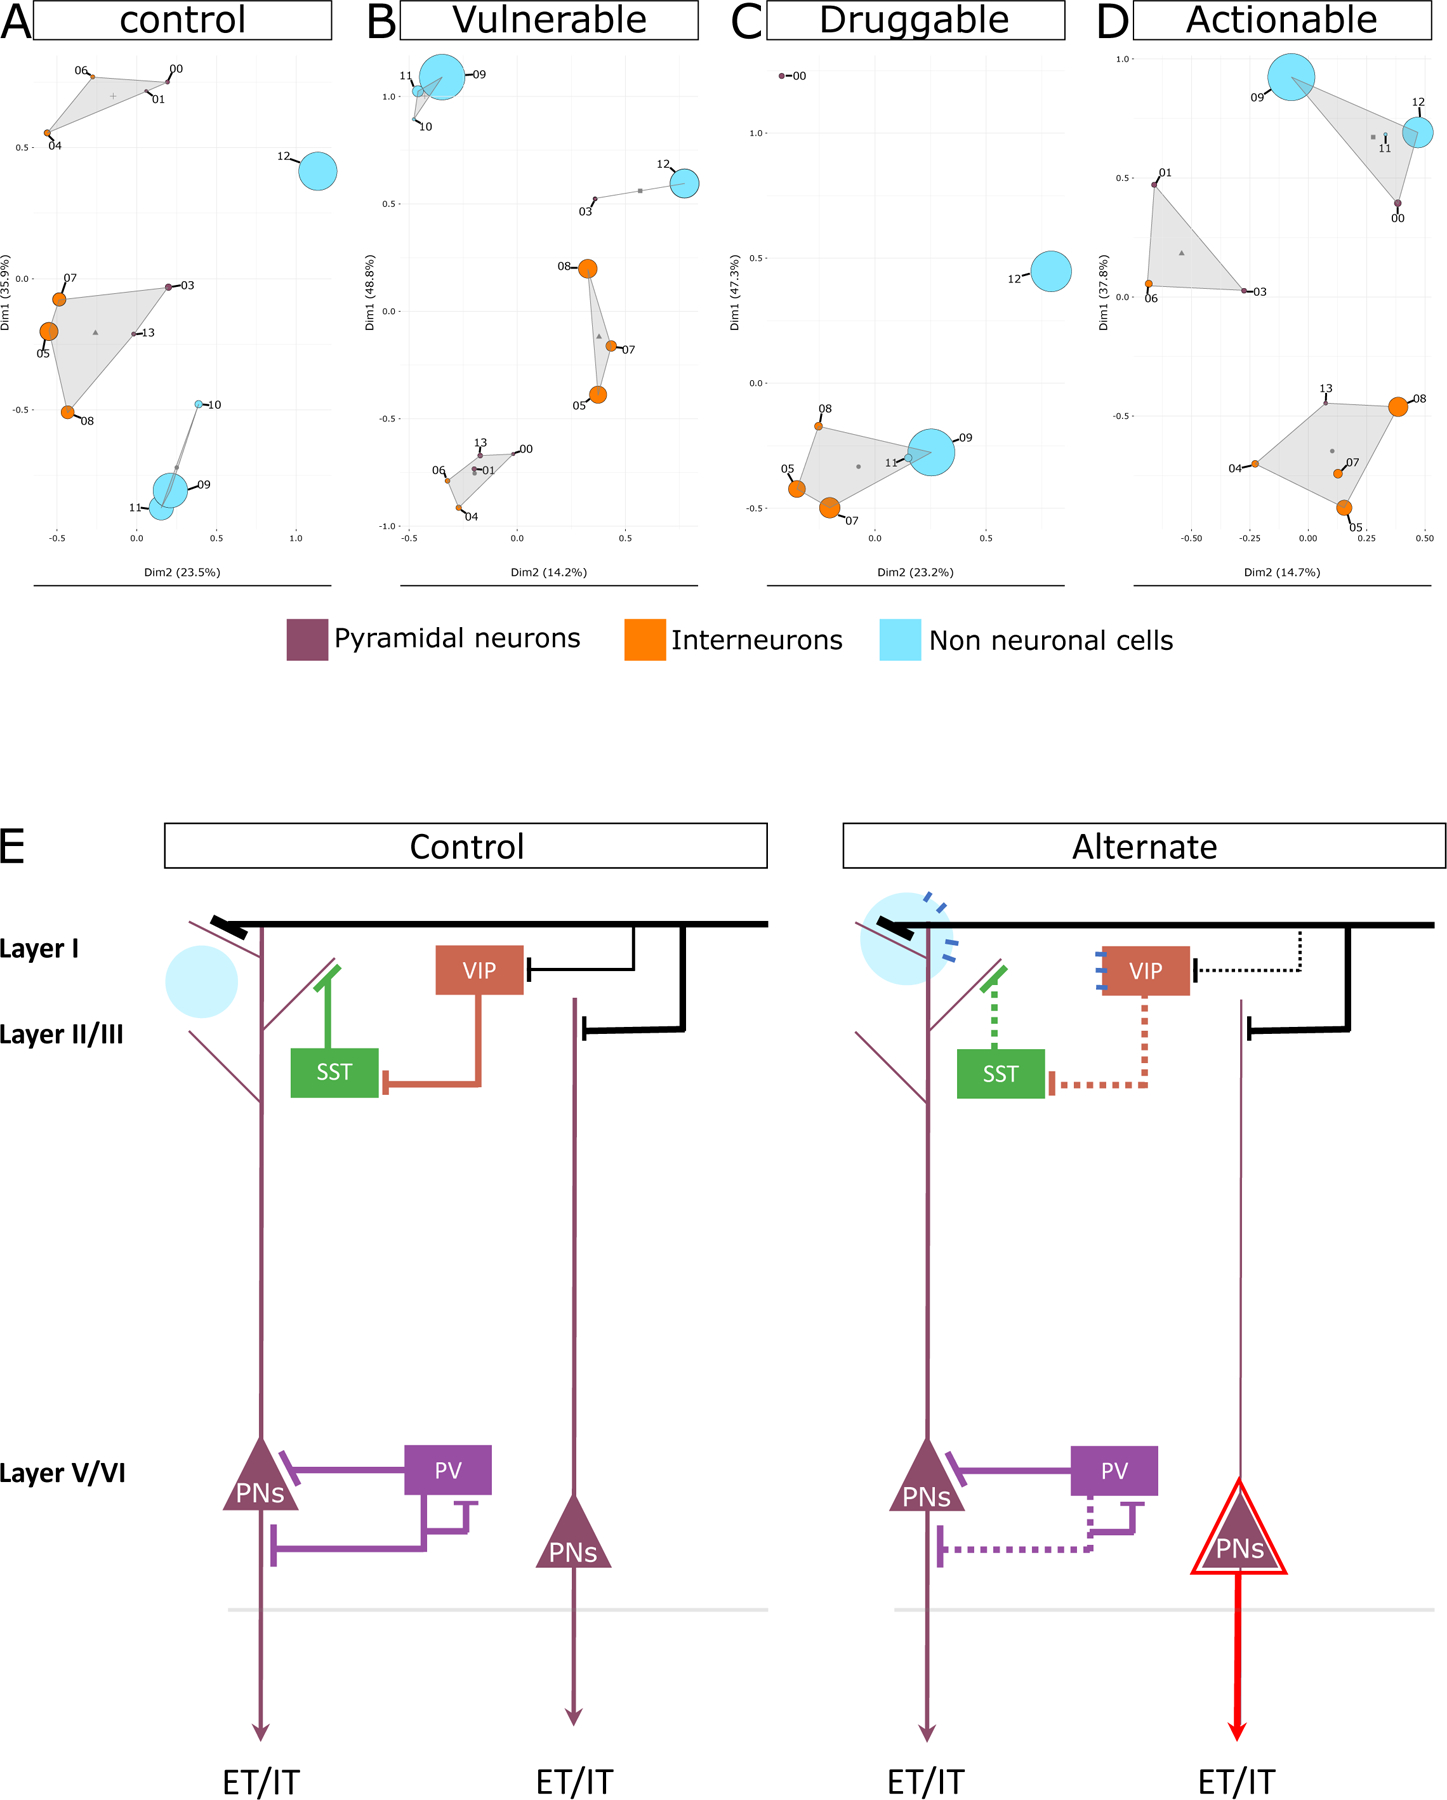
Figure 5. Functional clustering of cell types in control, disease, druggable, and actionable state.

Principal component-based clustering of the complete GO terms profiles associated with each cell type cluster (shown as circles) in A) cell type-specific control state, B) disease state, C) druggable state, and D) actionable state. Cell type clusters are labeled by their respective numbers as shown in Figure 1. Non-neuronal clusters are depicted in blue, interneuron clusters are depicted in orange, and PN cluster are depicted in purple. The size of each circle is proportional to the number of pathways associated with the cell type cluster. Circles that are closer in space exhibit stronger functional similarity, with triangles indicating the centroid of the functional cluster. E) Summary of drug and disease action inferred in this study. The control state depicts canonical cortical neurons and their connections in healthy state. The alternate state represents the vulnerable, druggable, and actionable state discussed in this study. Extratelencephalically (ET) or intratelencephalically (IT) projecting layer-5 PNs are shown. As indicated by the dotted lines, interneurons demonstrated greater vulnerability in a disease state, and VIP and SST neurons were the most vulnerable interneurons. As indicated by the black line representing distant inputs, the coordinated input to PNs and VIP interneurons in the control state decreases for VIP in the disease state, which may be compensated for by overexpression of monoamine-related effects in PNs during the actionable state, allowing it to bypass the lost disinhibition during the disease state. As indicated by the enlarged blue circle, astrocytes were more active in the disease state and interacted with a subset of PNs. A shared receptor between disinhibitory VIP interneurons and astrocytes may facilitate their coordinated action in the presence of volume transmission possibly during druggable state. As depicted by the red triangle, during drug activity, a subset of layer-5 PN becomes excessively active. Notably, disease action is usually superficial-layer focused, whereas drug action is deep-layer focused.
