
FIGURE 3.
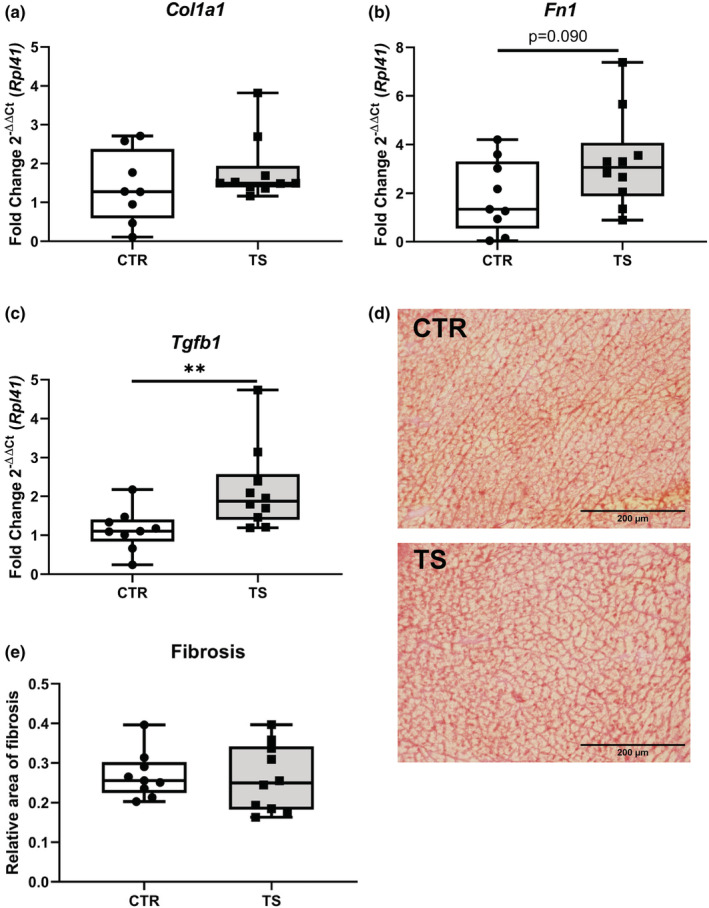
Analysis of fibrosis‐related genes in cardiomyocytes. (a) Collagen 1 (Col1a1); (b) Fibronectin (Fn1); (c) Transforming growth factor beta 1 (Tgfb1). CTR, control condition; TS, tail suspension condition. (d) Picrosirius Red staining of CTR and TS conditions. (e) Quantification of fibrosis area (μm2). Bar = 200 μm. 40× magnification. All experiments were performed with CTR = 9 mice; TS = 10 mice. Normality was assessed with D'Agostino and Pearson and depending on the outcome, differences between CTR and TS were analyzed using either the unpaired Student's t test or Mann–Whitney U test. Levels of significance were **p < 0.01.