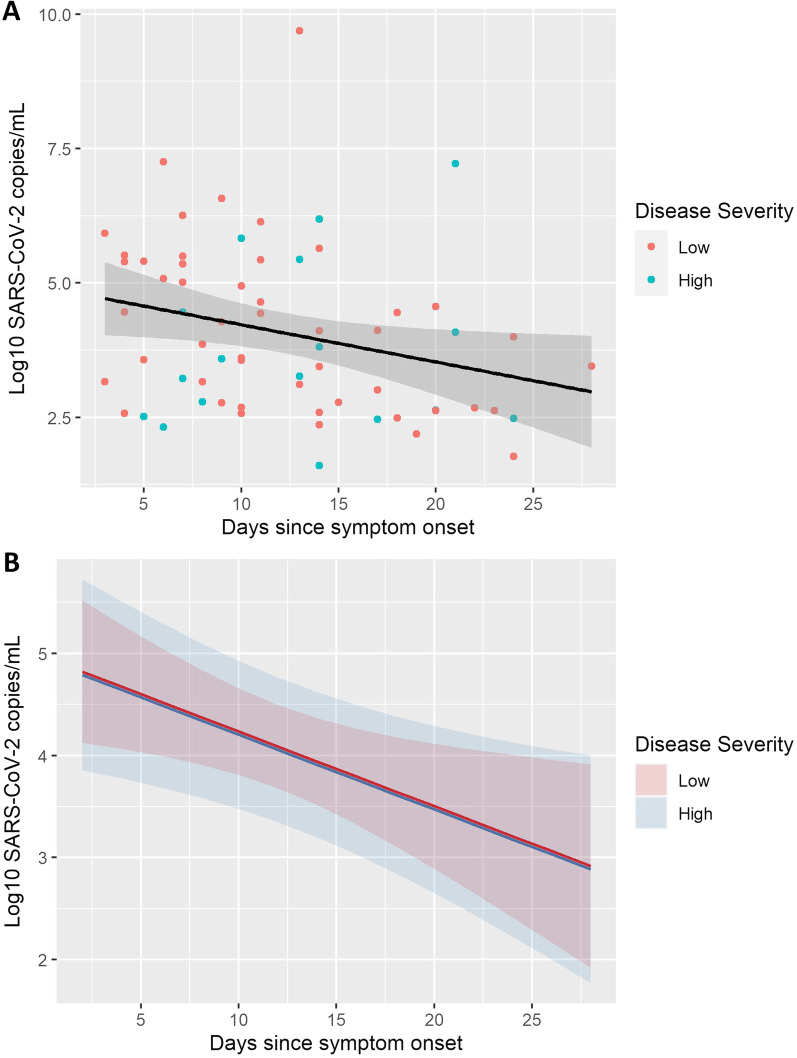
Fig. 5.
Scatter plot with a linear regression line describing log10 viral loads (log10 SARS-CoV-2 copies/mL) and a LME model predicting viral loads based on disease severity during the first 30 days of admission. Negative SARS-CoV-2 RT-PCR samples are not presented. All of the available positive samples were collected on days 0, 3, 7, 10 or 14 after hospital admission. The results are plotted in relation to symptom onset. A Scatter plot describing viral loads up to 30 days after symptom onset. Regression line is marked in black. Estimated decline in log10 viral load was –0.07 per day (-0.07, 95% CI [− 0.13–− 0.02]. Model used to calculate the decline in viral load over time was created with viral load as outcome and days since symptom onset, age, sex, and disease severity as predictors. Standard error is highlighted in grey around the black regression line. B LME model demonstrating the effect of disease severity on viral loads over time. Disease severity was not associated with an increase or a decrease in viral loads (− 0.03, 95% CI [− 0.80 – 0.76], p = 0.94). Standard error is highlighted in red (low disease severity) or blue (high disease severity) in the background depending on disease severity. Same outcome and predictors as in 5A were used in 5B

