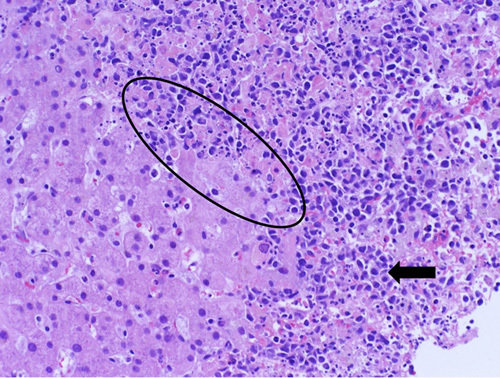
FIGURE 1.

Liver biopsy with hematoxylin and eosin. This shows preserved hepatic parenchyma transitioning into an area of “dirty” necrosis with admixed infiltrating atypical cells (circle). These large plasmacytoid cells demonstrate a variable amount of cytoplasm, and significant nuclear pleomorphism (arrow).
