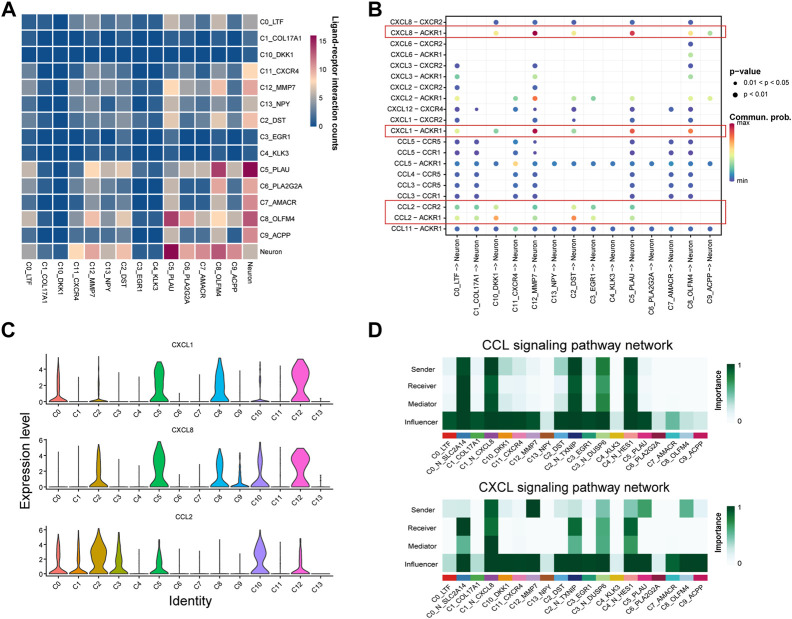
FIGURE 4.
Cell interaction networks in PNI-PCa. (A) Heatmap shows the number of potential ligand-receptor pairs between epithelial cell subtypes and neural cell sells predicted by Cellphone DB. The more red the color, the stronger cell-cell communication. (B) Bubble plot of ligand-receptor interactions between epithelial cell subtypes and neural cells, where the bubble size represents the p-value (the p-value of all bubbles is less than .05), the bigger the bubble, the smaller the p-value. The color represents cell interaction strength, the redder the color, the stronger the interaction. (C) Bar chart showing the expression levels of CCL2, CXCL1, and CXCL8 in each epithelial cell subgroup. (D) The communication probability of neural and epithelial cells on the CXCL and CCL signaling pathways.

