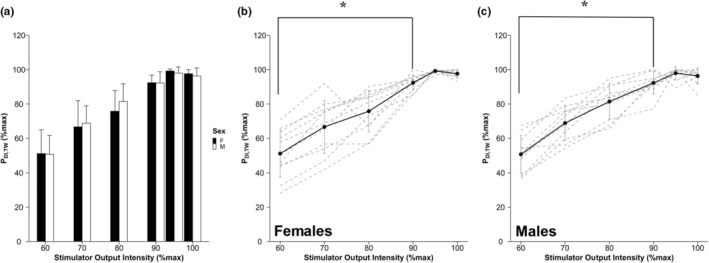
FIGURE 4.

Transdiaphragmatic twitch response to increasing stimulator output intensity. Bar graph depicting PDI,TW (mean ± SD) as a percent of max PDI,TW in response to increasing intensities of the magnetic stimulator (a). Mean (solid line) and individual responses (dashed lines) to increasing stimulator output intensity in females (b) and males (c). PDI,TW response did not significantly increase from 95% to 100%. PDI,TW, transdiaphragmatic twitch amplitude, *, significantly different from 100% (p < 0.05)
