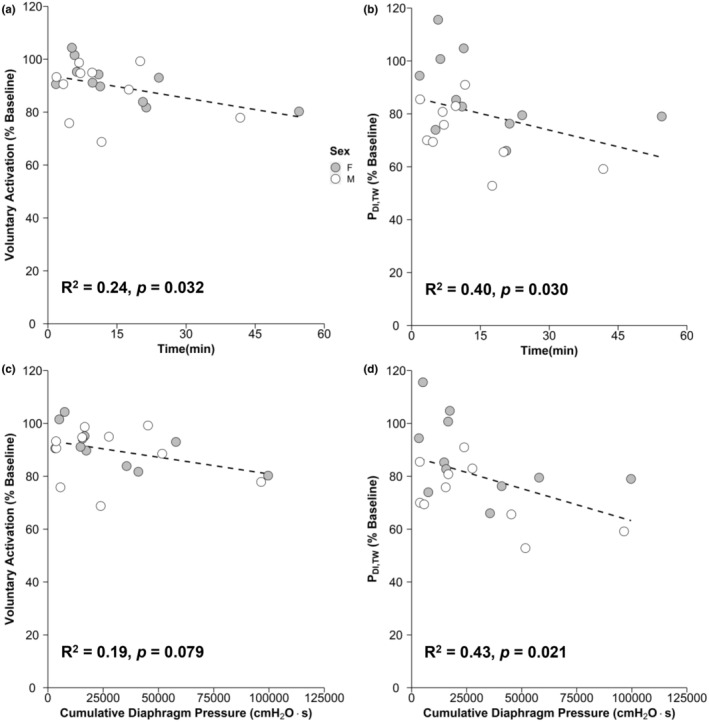
FIGURE 6.

Relationship between diaphragm fatigability outcomes and IPTL. Scatter plot showing the relationship between D‐VA after IPTL and TTF (a), PDI,TW and TTF (b), D‐VA after IPTL and cumulative diaphragm pressure output (c), and PDI,TW after IPTL and cumulative diaphragm pressure output (d). Dashed line is a linear regression representing the relationship between the associated variables. D‐VA, diaphragm voluntary activation; IPTL, inspiratory pressure threshold loading; PDI,TW, transdiaphragmatic twitch amplitude
