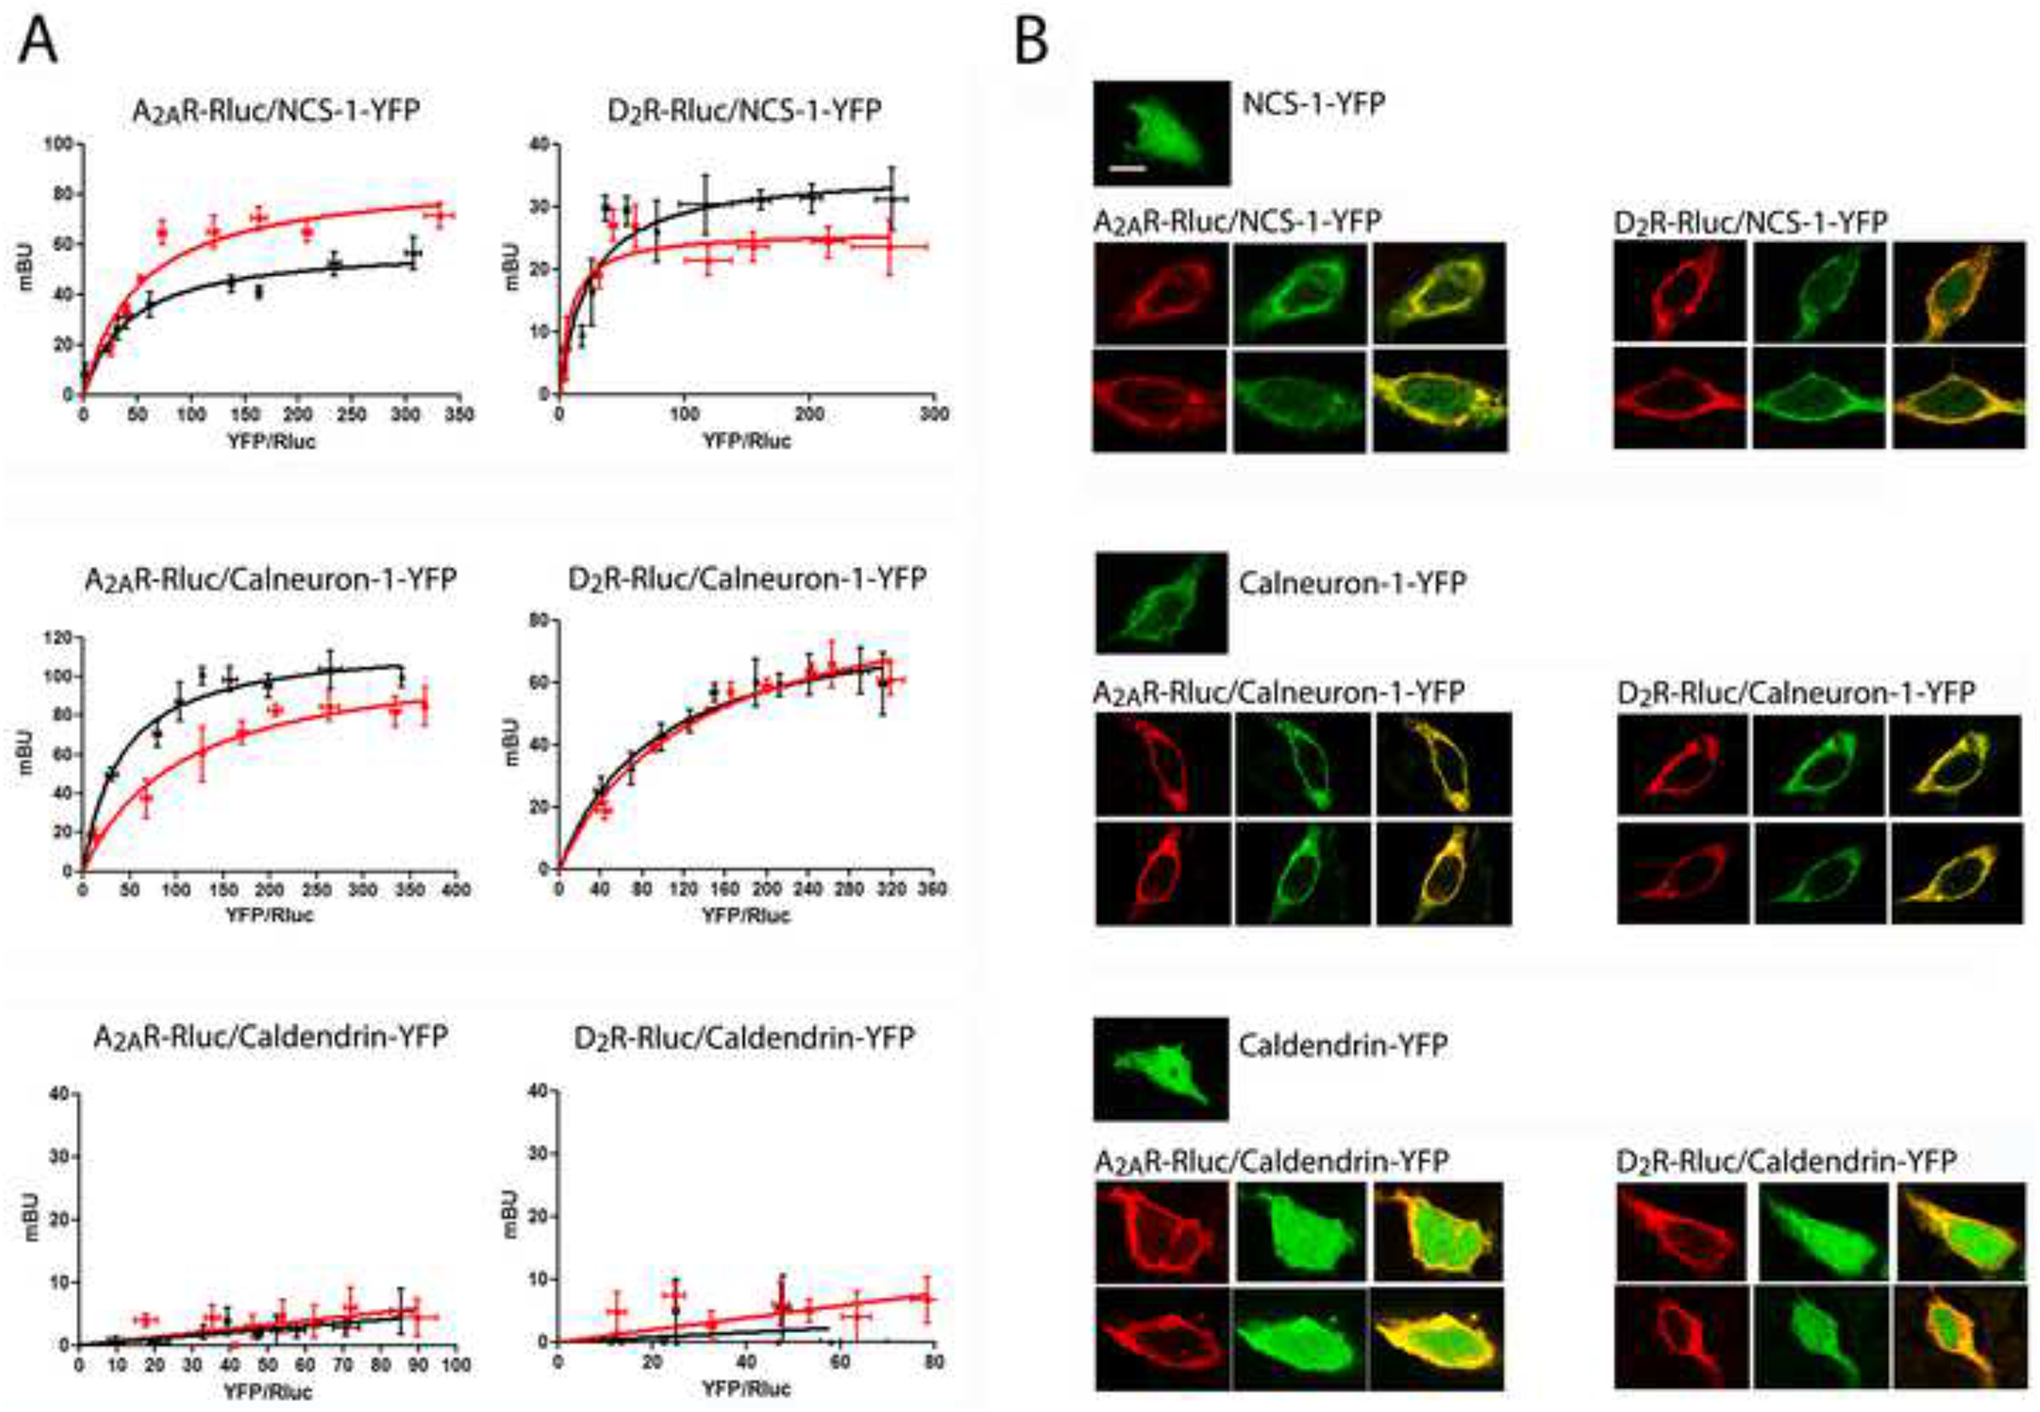
Figure 1. NCS-1 and calneuron-1 but not caldendrin interact with A2AR and D2R.

A. BRET saturation experiments in HEK-293T cells transfected with A2AR-Rluc cDNA (0.2 μg; left graphs) or D2R-Rluc cDNA (0.4 μg; right graphs) and increasing amounts of NCS-1-YFP cDNA (0.2 μg to 0.8 μg; top graphs), calneuron-1-YFP cDNA (0.4 μg to 1.2 μg; middle graphs) or caldendrin-YFP cDNA (0.2 μg to 1 μg; bottom graphs), in the absence (black curves) or in the presence (red curves) of 1 μM ionomycin. The relative amount of BRET is given as a function of 1000 × the ratio between the fluorescence of the acceptor (YFP) and the luciferase activity of the donor (Rluc). BRET is expressed as mili BRET units (mBU) and is given as means ± S.E.M. of 5 to 7 different experiments grouped as a function of the amount of BRET acceptor. B. Confocal microscopy images of HEK-293T cells transfected with NCS-1-YFP cDNA (0.5 μg; top panels), calneuron-1-YFP cDNA (0.7 μg; middle panels) or caldendrin-YFP cDNA (0.5 μg; bottom panels), co-transfected or not with A2AR-RLuc cDNA (0.4 μg; left panels) or D2R-Rluc cDNA (0.6 μg; right panels). Receptors were identified by immunocytochemistry (red) and proteins fused to YFP were identified by its own fluorescence (green). Co-localization is shown in yellow in merge figures. Scale bar: 10 μm.
