
Figure 4. Modulation by NCS-1 and calneuron-1 of A2AR-D2R heteromer signaling in transfected cells.
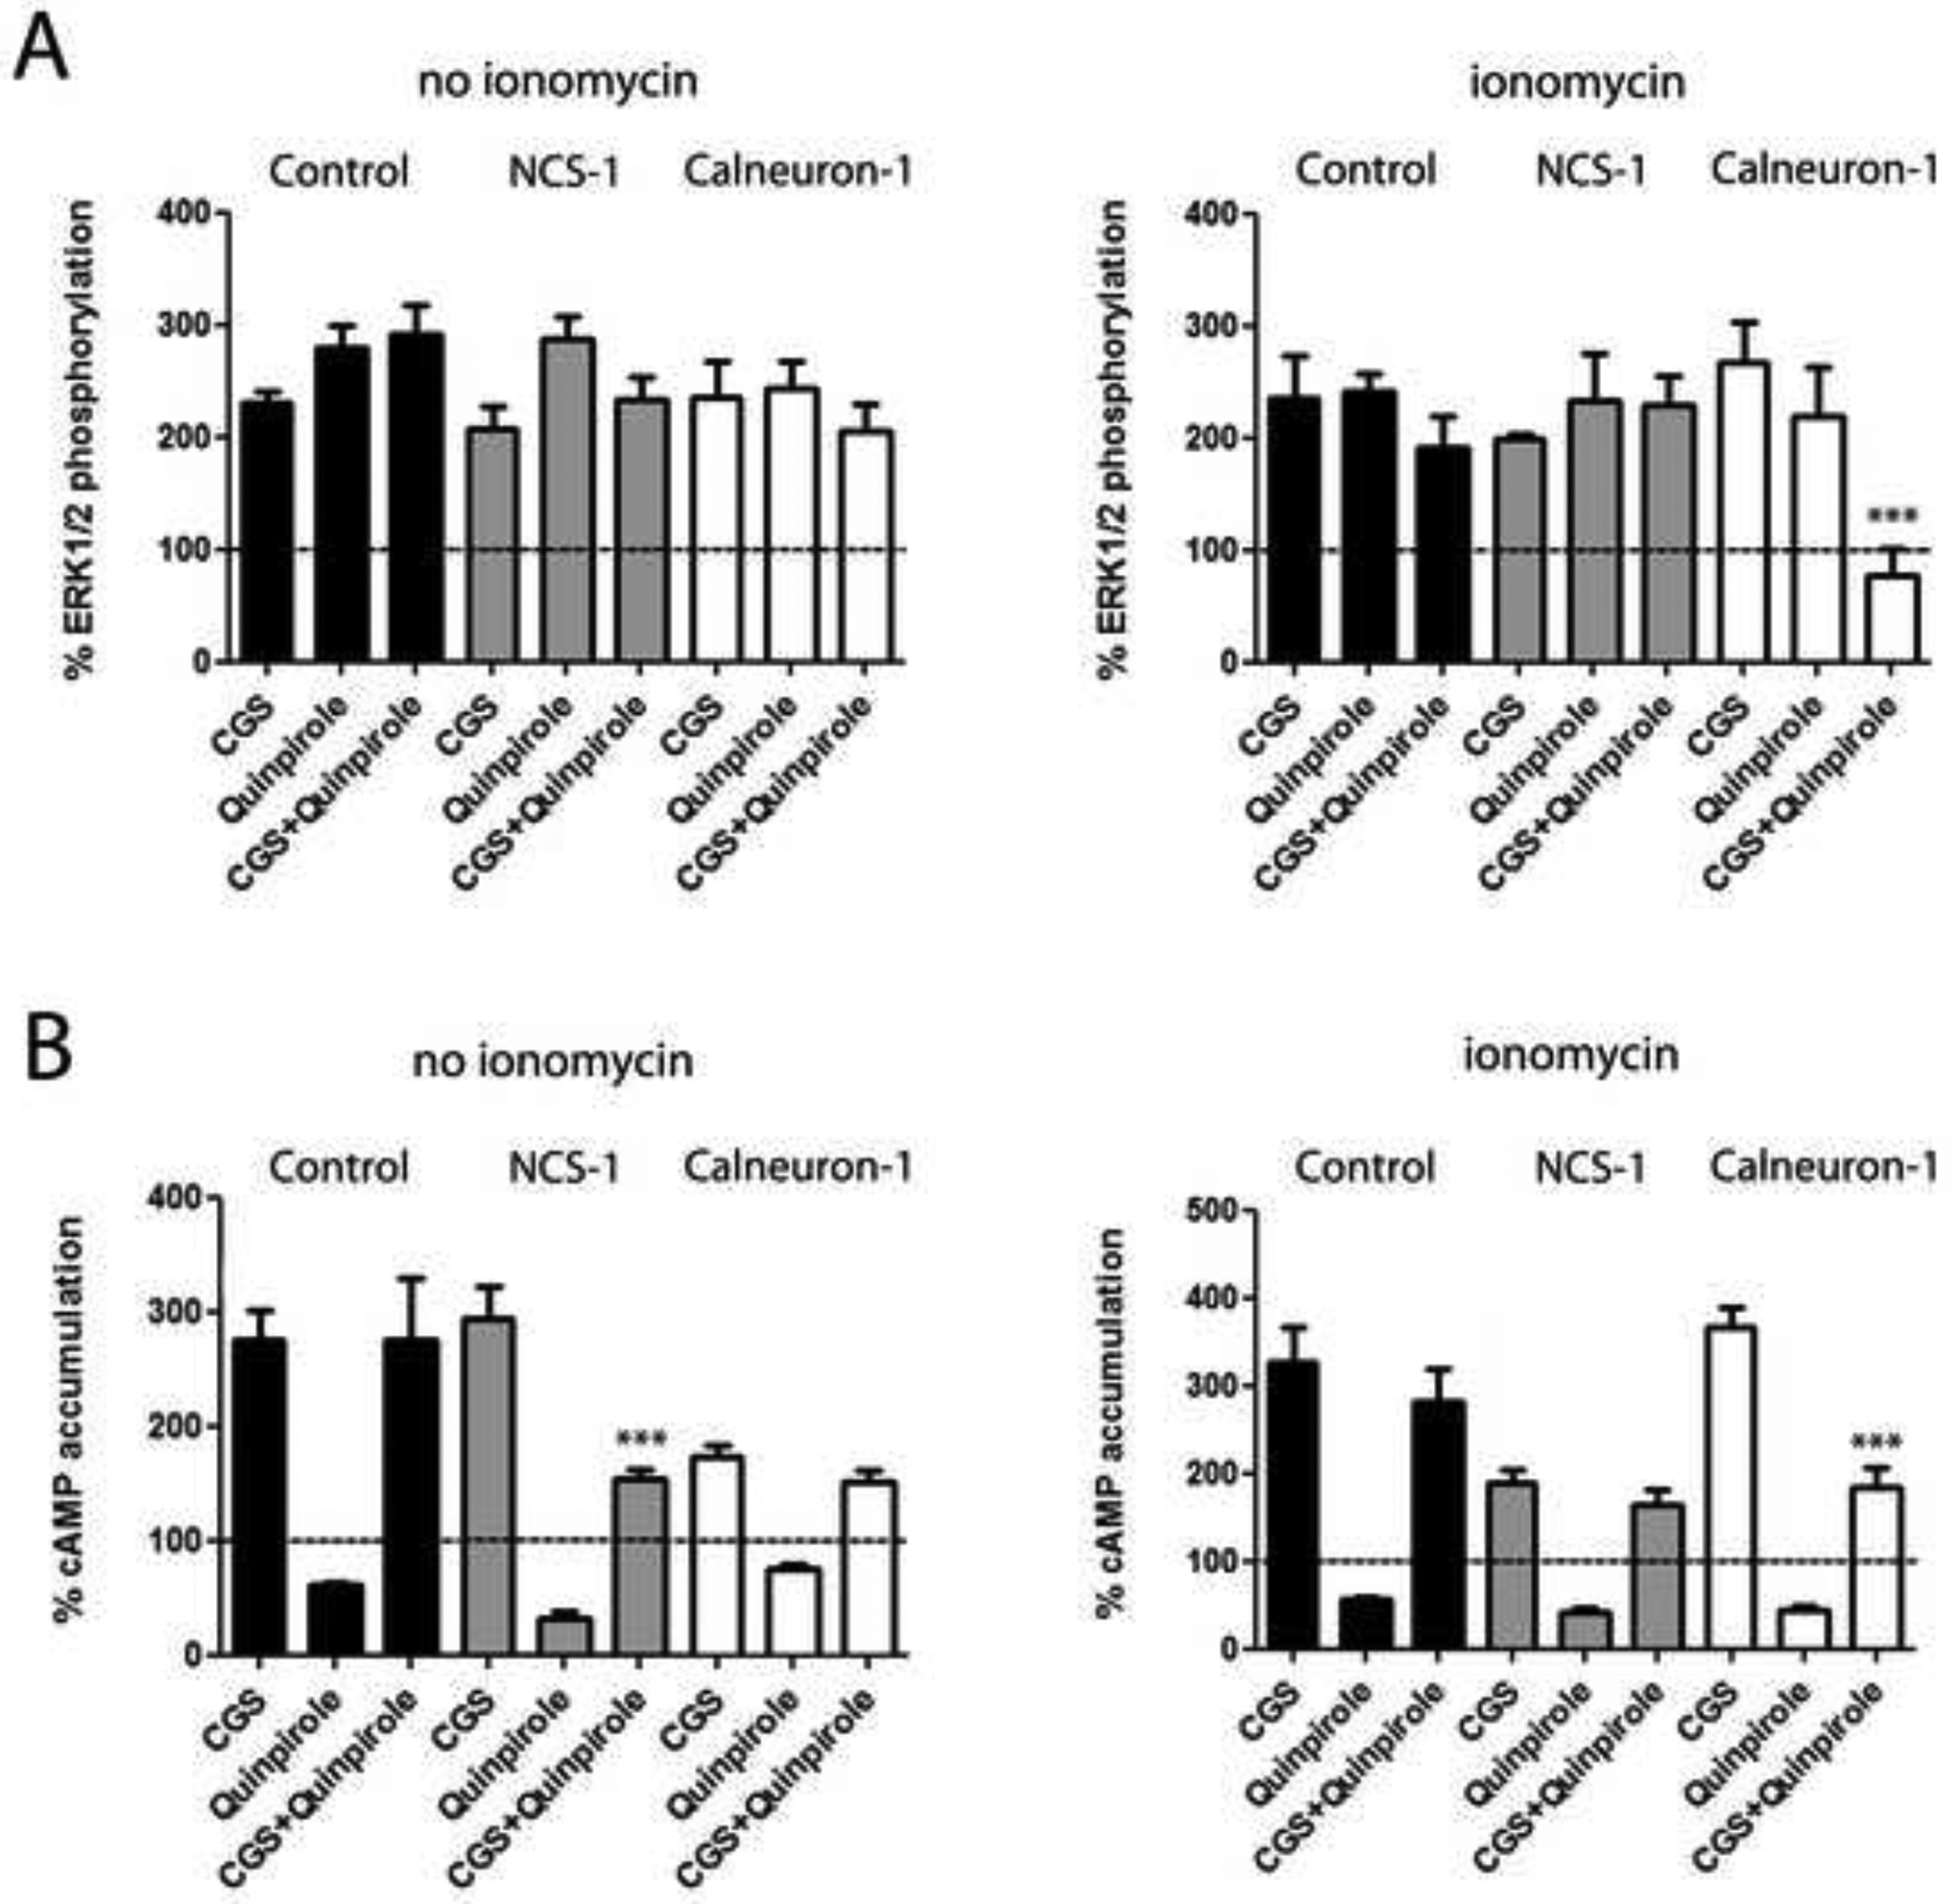
A. ERK1/2 phosphorylation in HEK-293T cells transfected with A2AR-Rluc cDNA (0.3 μg) and D2R-YFP cDNA (0.5 μg) alone (black bars) or also transfected with NCS-1 cDNA (0.4 μg cDNA; grey bars) or calneuron-1 cDNA (0.6 μg; white bars) after administration of the A2AR agonist CGS 21680 (CGS, 100 nM), the D2R agonist quinpirole (1 μM) or both, in the absence or presence of ionomycin (left and right graphs, respectively). ERK1/2 phosphorylation levels are expressed as a percentage over basal. B. Levels of cAMP in HEK-293T cells transfected with A2AR-Rluc cDNA (0.3 μg) and D2R-YFP cDNA (0.5 μg) alone (black bars) or also transfected with NCS-1 cDNA (0.4 μg cDNA; grey bars) or calneuron-1 cDNA (0.6 μg; white bars) after administration of the A2AR agonist CGS 21680 (CGS, 100 nM), the D2R agonist quinpirole (1 μM) or both, in the absence or presence of ionomycin (left and right graphs, respectively). Levels of cAMP after CGS alone or after CGS plus quinpirole are expressed as a percentage over basal; cAMP after quinpirole alone are expressed as percentage of decreases with respect to cAMP induced by forskolin (0.5 μM); basal and forskolin-induced cAMP were given as 100% and represented by a dotted line. were determined in the absence (a and c) or presence (b and d) of 1 μM ionomycin. Values are mean ± S.E.M. of 4 to 6 different experiments. One-way ANOVA followed by post hoc Dunnett’s multiple comparisons: ***p < 0.001 versus CGS 21680 treatment.