. 2023 Jan 25;131(1):017007. doi: 10.1289/EHP11164

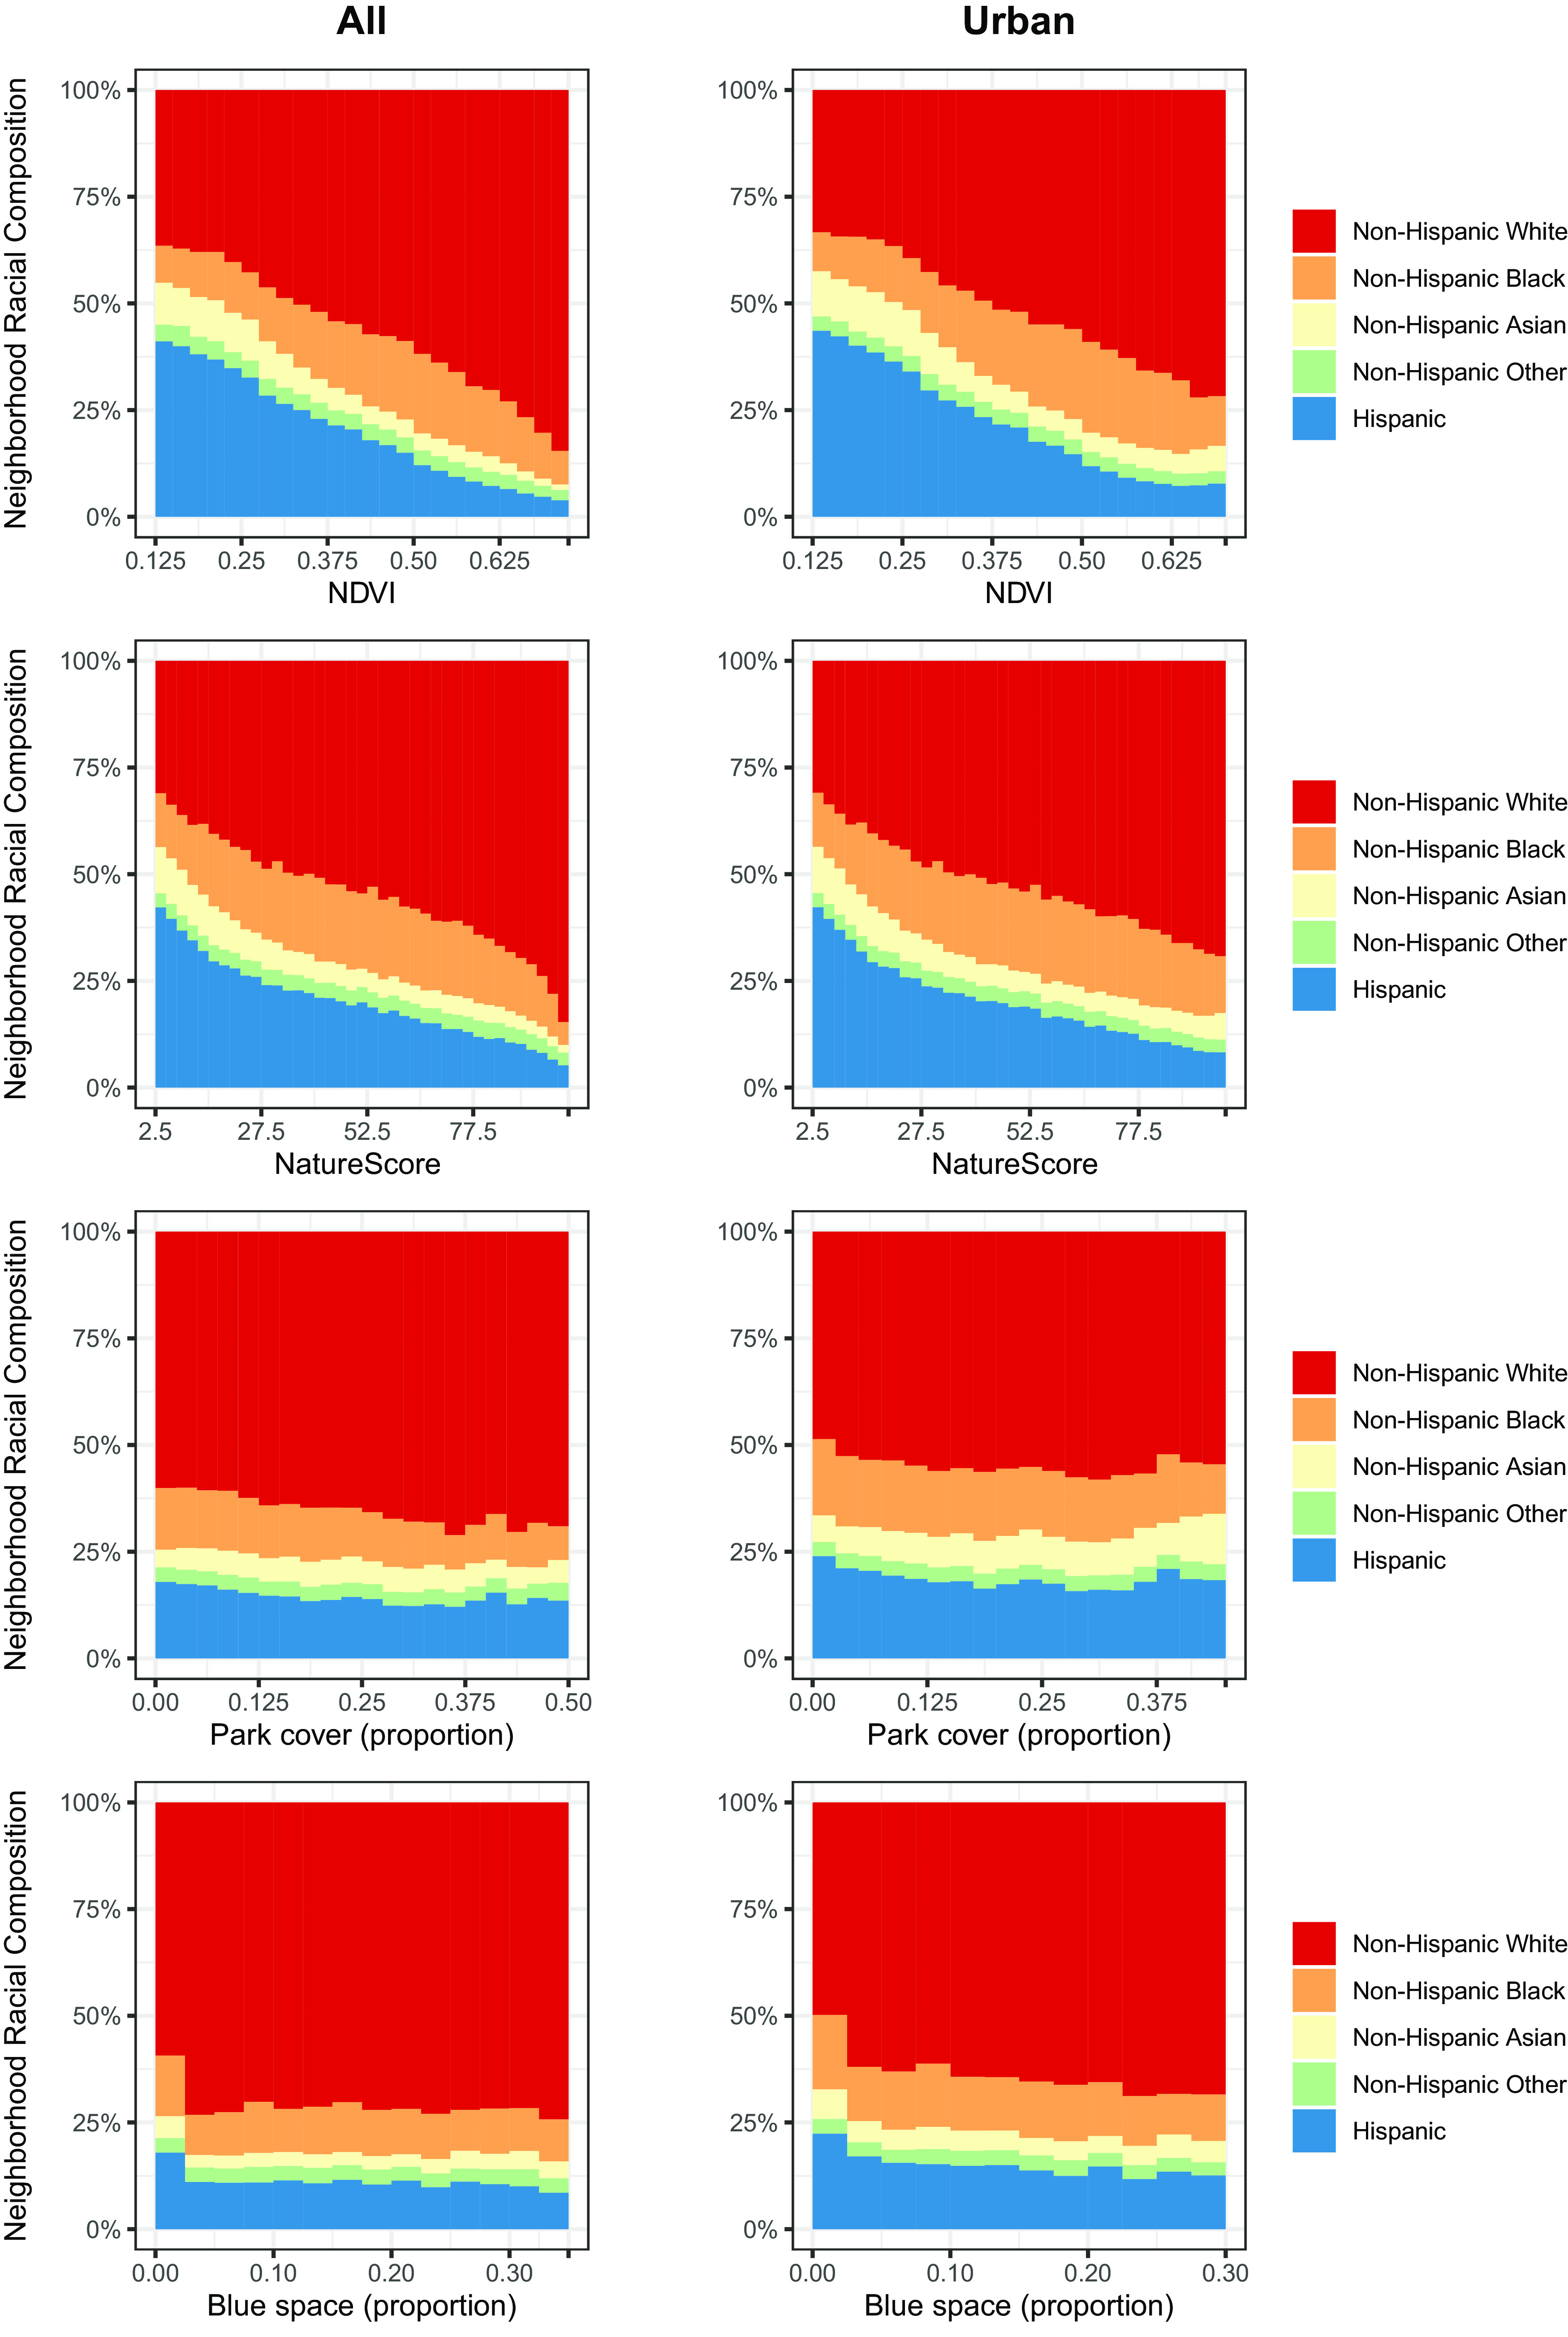
Figure 2.

Figure 2 is a set of eight area graphs. On the left, a set of four area graphs titled All, plotting Neighborhood Racial Composition, ranging from 0 to 100 percent in increments of 25 (y-axis) across Normalized Difference Vegetation Index, ranging from 0.125 to 0.625 in increments of 0.125, NatureScore, ranging from 2.5 to 77.5 in increments of 25, Park cover (proportion), ranging from 0.00 to 0.50 in increments of 0.125, and Blue space (proportion), ranging from 0.00 to 0.30 in increments of 0.10 (x-axis) for Non-Hispanic White, Non-Hispanic Black, Non-Hispanic Asian, Non-Hispanic Other, and Hispanic. On the right, a set of four area graphs titled Urban, plotting Neighborhood Racial Composition, ranging from 0 to 100 percent in increments of 25 (y-axis) across Normalized Difference Vegetation Index, ranging from 0.125 to 0.625 in increments of 0.125, NatureScore, ranging from 2.5 to 77.5 in increments of 25, Park cover (proportion), ranging from 0.00 to 0.375 in increments of 0.125, and Blue space (proportion), ranging from 0.00 to 0.30 in increments of 0.10 (x-axis) for Non-Hispanic White, Non-Hispanic Black, Non-Hispanic Asian, Non-Hispanic Other, and Hispanic.

Average 2015–2019 race/ethnicity composition by levels of NDVI (2019 data), NatureScore (2020 data), park cover (2020 data), and blue space (1984–2018 data) in all census tracts (n=71,532) and in urban census tracts (n=45,338) in the contiguous United States after excluding census tracts with missing data. See Tables S2–S9 for corresponding numeric data. The x-axis of each plot was truncated by the 2.5 and 97.5 percentile. Note: NDVI, Normalized Difference Vegetation Index.