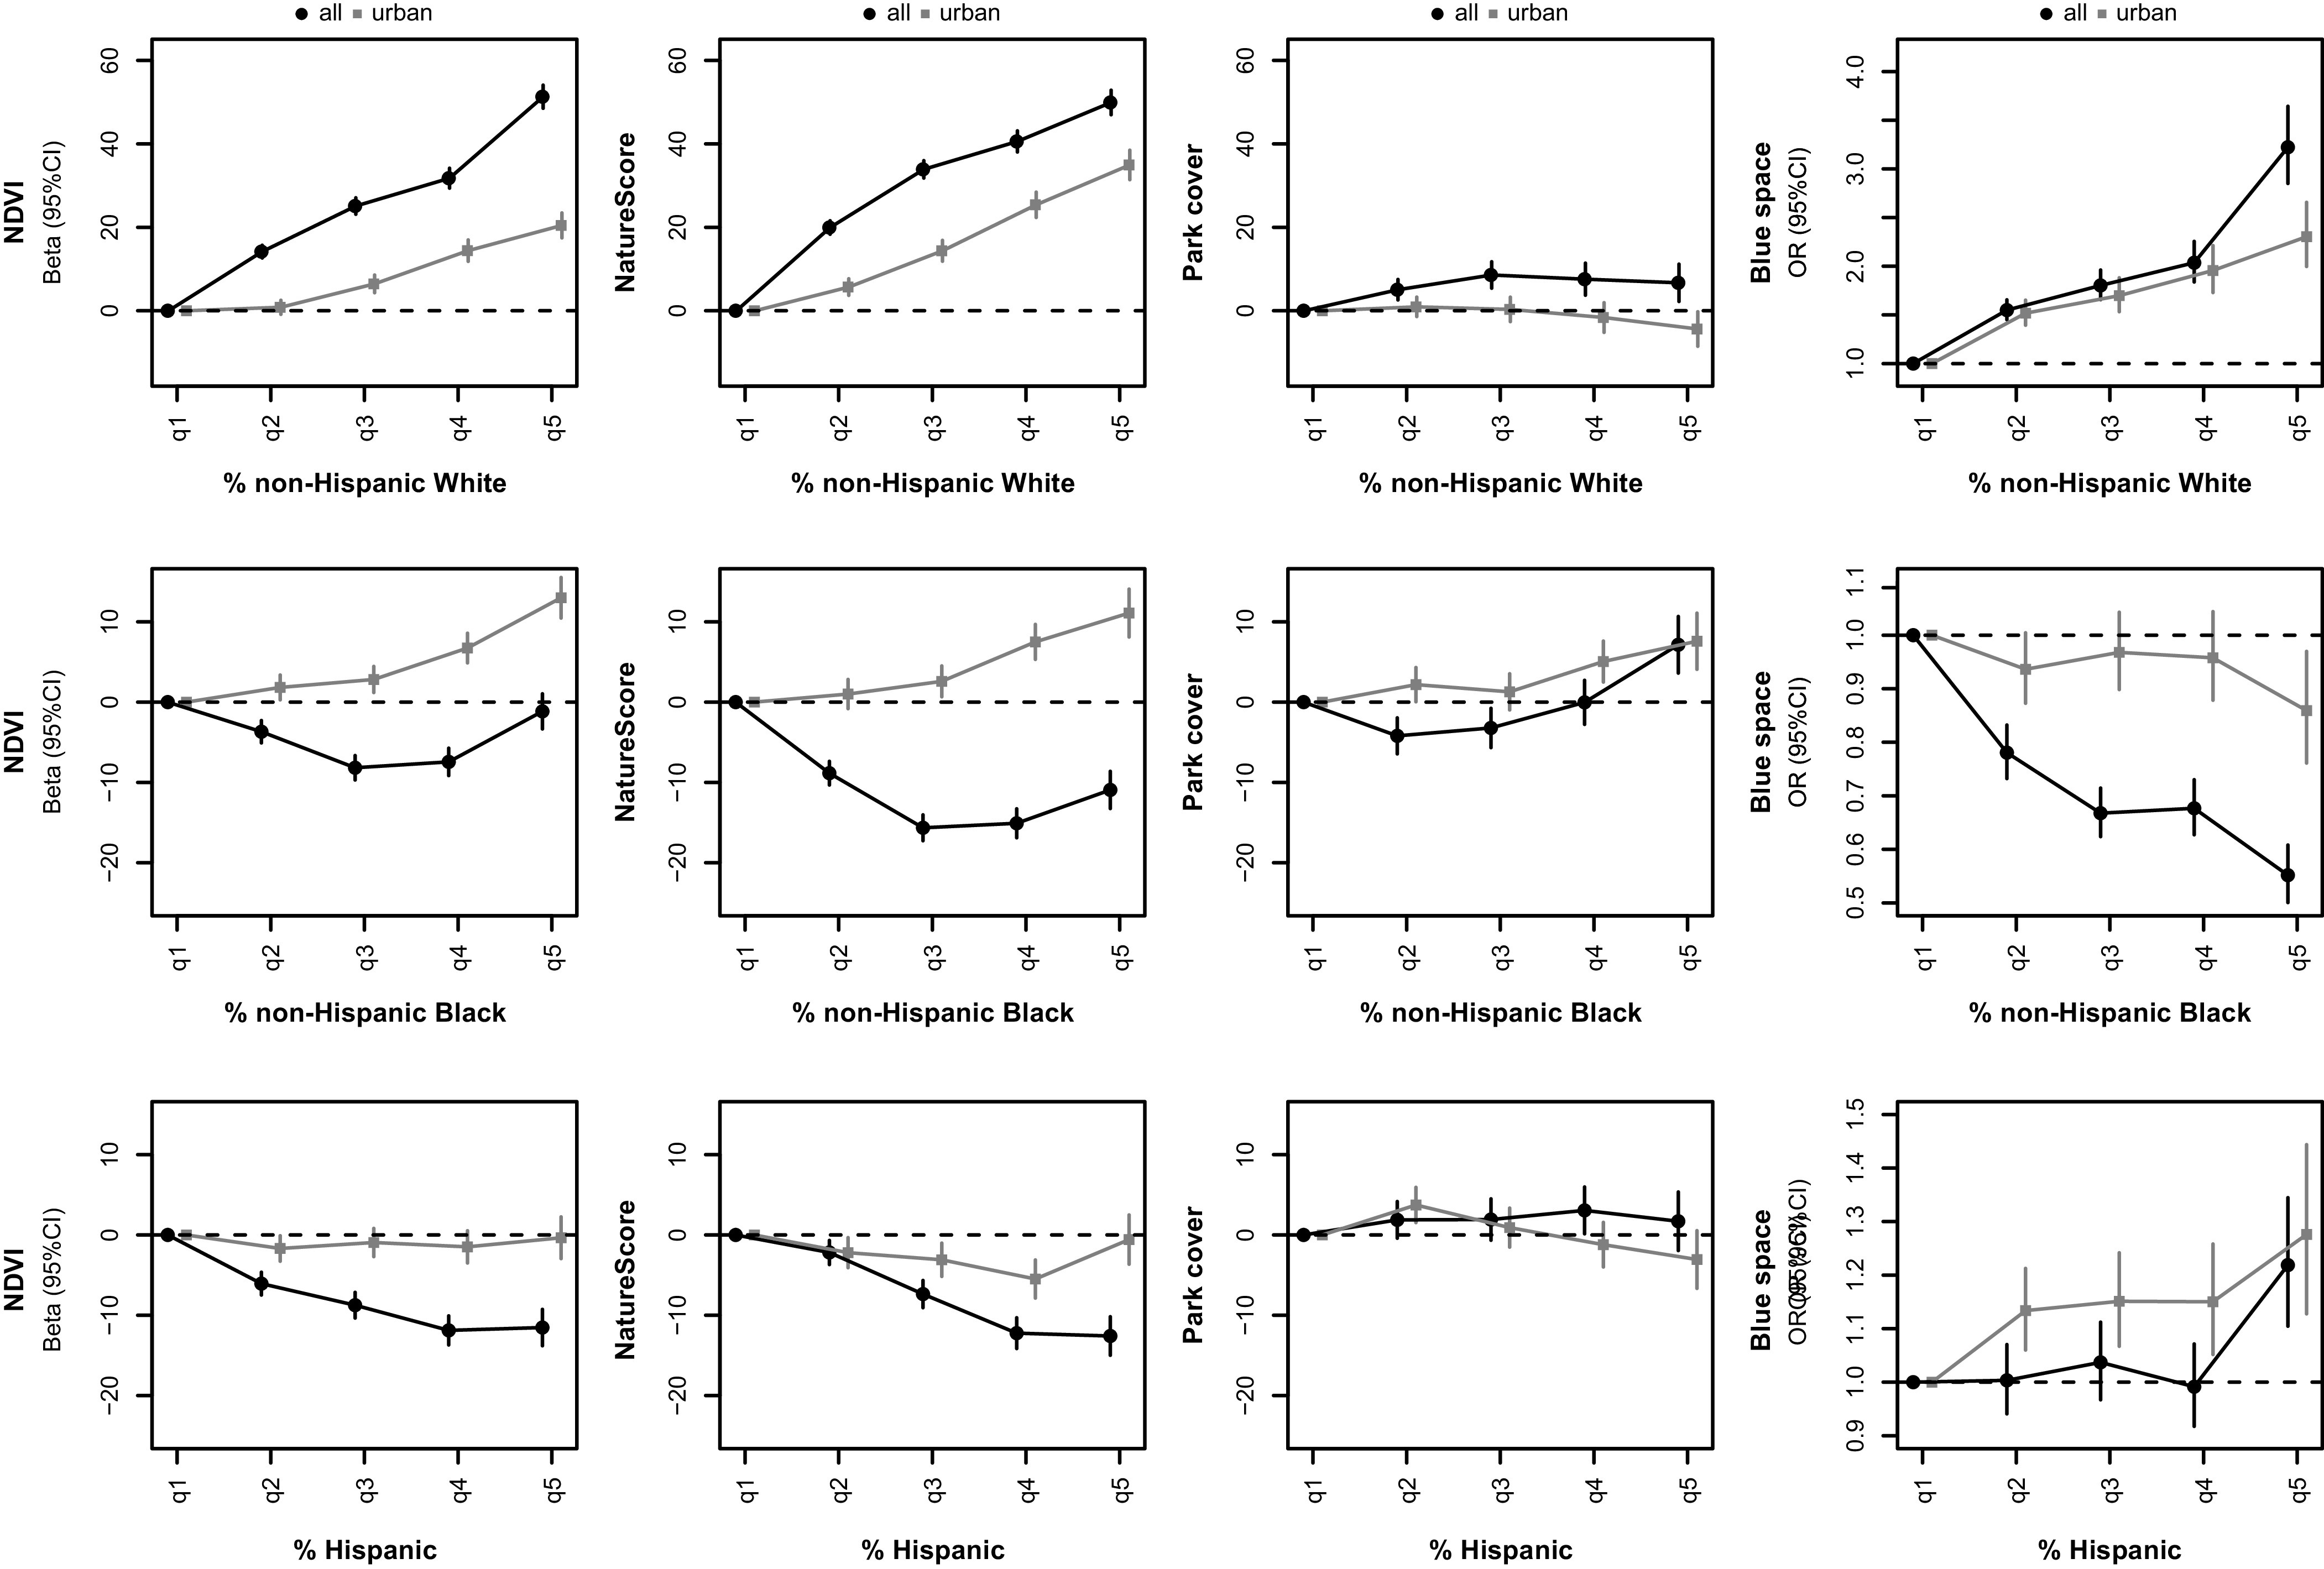
Figure 4.

Associations of 2015–2019% non-Hispanic White, %non-Hispanic Black, and %Hispanic with NDVI (2020 data), NatureScore (2019 data), park cover (2020 data), and blue space (1984–2018 data) in all census tracts (, ●) and in urban census tracts (,  ) in the contiguous United States after excluding census tracts with missing data. See Table S11 for corresponding numeric data. NDVI, NatureScore, and park cover were standardized and multiplied by 100, so that the beta represents the percentage increase/decrease of the SD (NDVI: 0.18, NatureScore: 33.4, Park cover: 0.13). The error bars correspond to 95% CIs. Models included %non-Hispanic White, %non-Hispanic Black, %non-Hispanic Asian, %non-Hispanic Other, %Hispanic and were adjusted for median age, population density, temperature, precipitation, median household income, and latitude and longitude of the centroid. For all census tracts, the following percentiles (20, 40, 60, 80) were used to create %non-Hispanic White quintiles: 30.2, 60.4, 78.0, 89.9; %non-Hispanic Black quintiles: 0.6, 2.4, 6.8, 20.3; %Hispanic quintiles: 2.1, 5.2, 11.1, 27.0. For urban census tracts, the following percentiles (20, 40, 60, 80) were used to create %non-Hispanic White: 18.0, 45.8, 66.3, 81.1; %non-Hispanic Black quintiles: 1.3, 4.0, 9.7, 26.0; %Hispanic quintiles: 3.7, 8.3, 16.6, 36.6. Note: %, percentage; CI, confidence interval; NDVI, Normalized Difference Vegetation Index; OR, odds ratio; q, quartile; SD, standard deviation.
