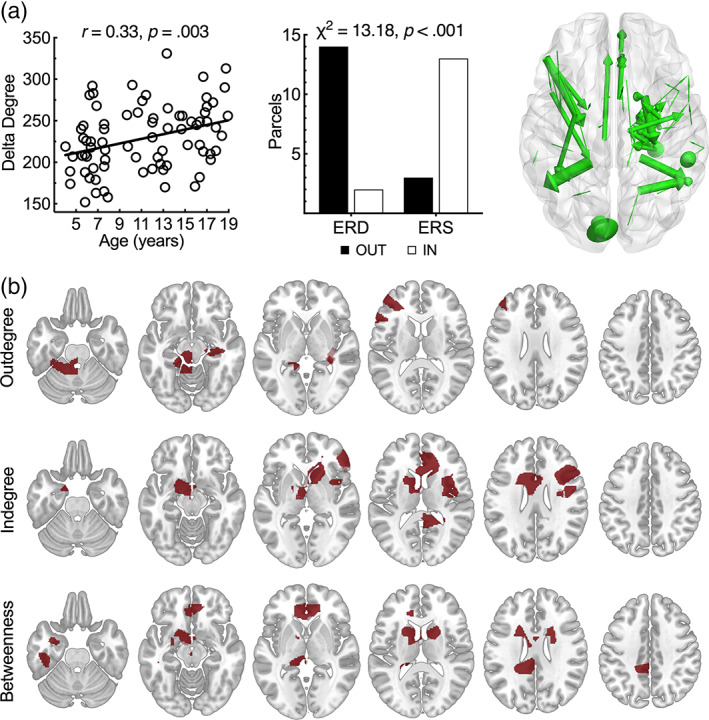
FIGURE 2.

In (a), scatterplot shows significant correlations between age and delta (1–4 Hz) band degree based on normalized phase slope index in 80 children and adolescents performing verb generation. Bar plot (center) displays a significant association between direction of oscillatory changes and direction of information flow. Top 1% of all edges (right) during verb generation is shown across all participants. In (b), axial slices show delta band outdegree (top row) and indegree (middle row). Outdegree and indegree for delta reflect intrahemispheric connections. Axial slices show delta band betweenness centrality based on phase slope index (bottom row).
