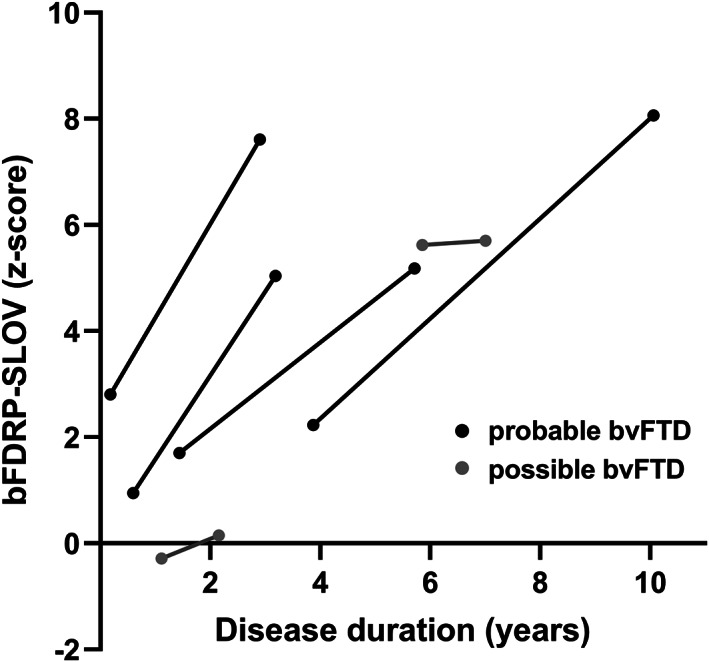
FIGURE 2.

Longitudinal analysis of bvFTD patients that underwent FDG‐PET twice. Lines represent changes in bFDRP‐SLOV expression scores between the two scans in individual patients. Clinical diagnosis of probable or possible bvFTD was based on Rascovsky et al. (2011).
