FIGURE 5.

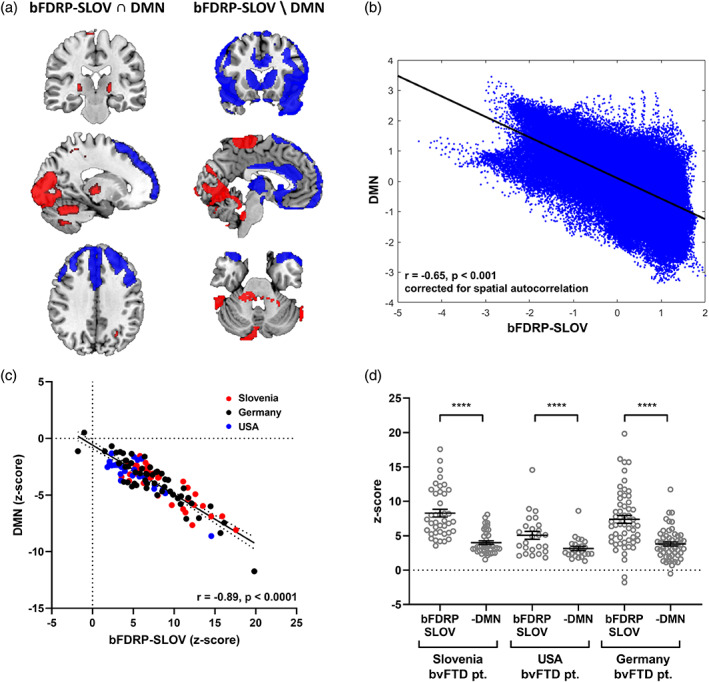
Comparison between bFDRP‐SLOV and default mode network (DMN). (a) left: Topography of overlapping areas of bFDRP‐SLOV and DMN patterns (overlapping hypoactive bFDRP‐SLOV and DMN loss areas are color‐coded blue, overlapping hyperactive bFDRP‐SLOV areas and DMN‐non‐affected areas are color‐coded red); right: topography of bFDRP‐SLOV specific regions after DMN regions were excluded. (b) Significant correlation between bFDRP‐SLOV and DMN topographies (r = −.65, p < .001, corrected for spatial autocorrelation) and (c) subject scores derived from both patterns (r = −.89, p < .0001). (d) bvFTD patients' expression scores calculated on both patterns (bFDRP‐SLOV and DMN loss) and standardized (z‐scored) to same healthy controls significantly differed in all three sites (****p < .0001, paired t‐test).
