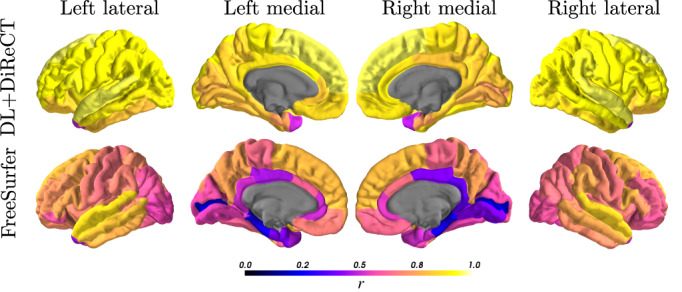
FIGURE 2.

Color‐coded Pearson correlation coefficients (r) of the ROI‐wise average cortical thicknesses between measures derived from all pairs of non‐enhanced and CE images

Color‐coded Pearson correlation coefficients (r) of the ROI‐wise average cortical thicknesses between measures derived from all pairs of non‐enhanced and CE images