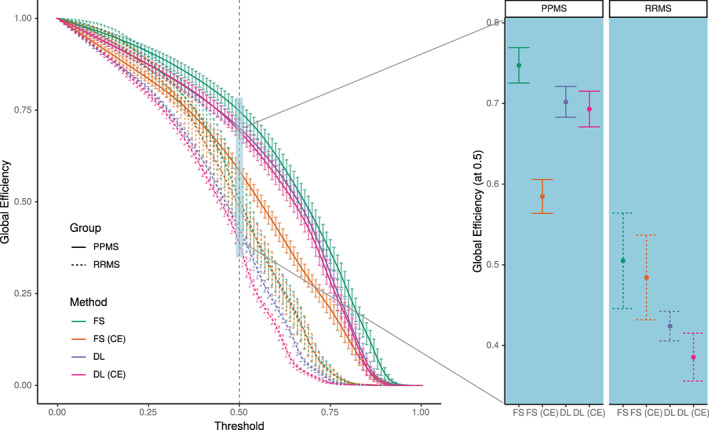
FIGURE 5.

Global efficiency metric for the PPMS and RRMS subgroups calculated from structural covariance networks derived from non‐enhanced and contrast‐enhanced (CE) images with FreeSurfer (FS) and DL+DiReCT (DL). Left: Global efficiency as a function of threshold applied on the correlation matrix. Right: Results corresponding to the threshold at 0.5. Error bars indicate one standard deviation
