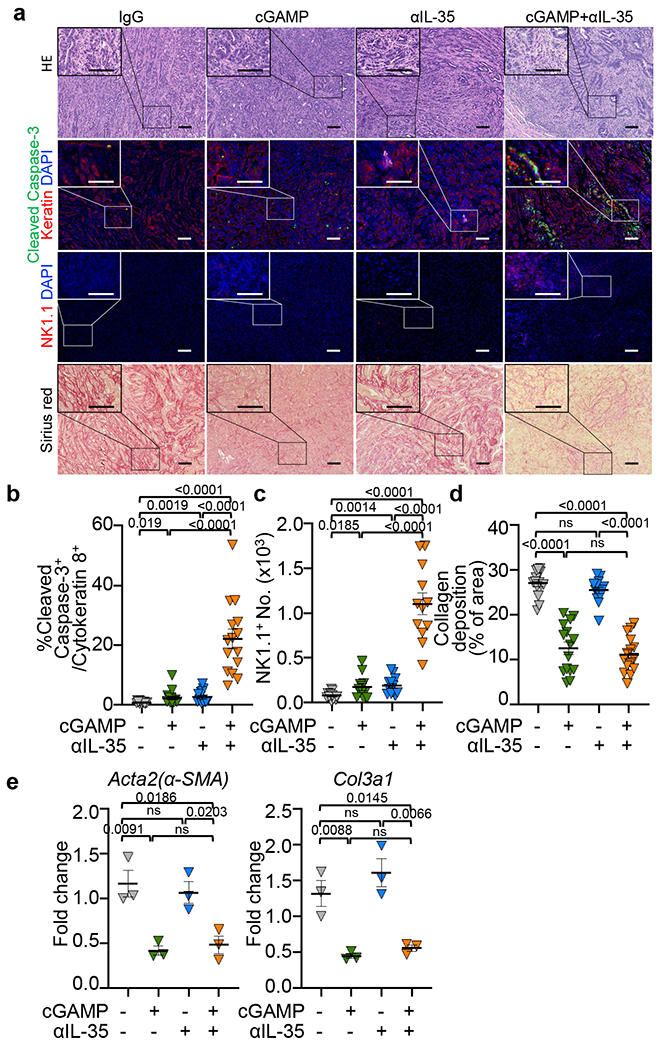
Extended Data Fig. 7 |. Immune profiles of combination cGAMP+anti-IL-35 treated tumours are examined.

All samples analyzed were obtained from KPC4662 tumour-bearing mice that were injected with cGAMP or PBS in combination with anti-IL-35 or control IgG as depicted in Fig. 4a. a, H&E, immunohistochemistry with the indicated markers and Sirius red staining of sections from groups as described in Fig. 4a (Scale bars, 100 μm.). b, The frequency of cleaved caspase-3+ in cytokeratin 8+ cells as shown in (a), n=15 per group. c, The number of NK1.1+ cells as shown in (a), n=12 per group. d, The quantification of collagen deposition depicted by Sirius red staining in sections as shown in (a), n=15 per group. e, Real-time PCR results revealed the expression of fibrosis markers Acta2 (αSMA) and Col3a1 in tumour homogenates of indicated groups; n=3 per group. Actb was used as the internal control. A combination of two (Extended Data Fig. 7a–d) or representative of two independent experiments (Extended Data Fig. 7e) are shown. Mean ± s.e.m. is shown, Unpaired two-tailed Student’s t tests was performed for statistical analysis. P values indicated; ns, not significant.
