
Extended Data Fig. 4 |. Immune profiling of pancreatic tumour-bearing B cell-specific IL-35 or IL-10 ablation mice.
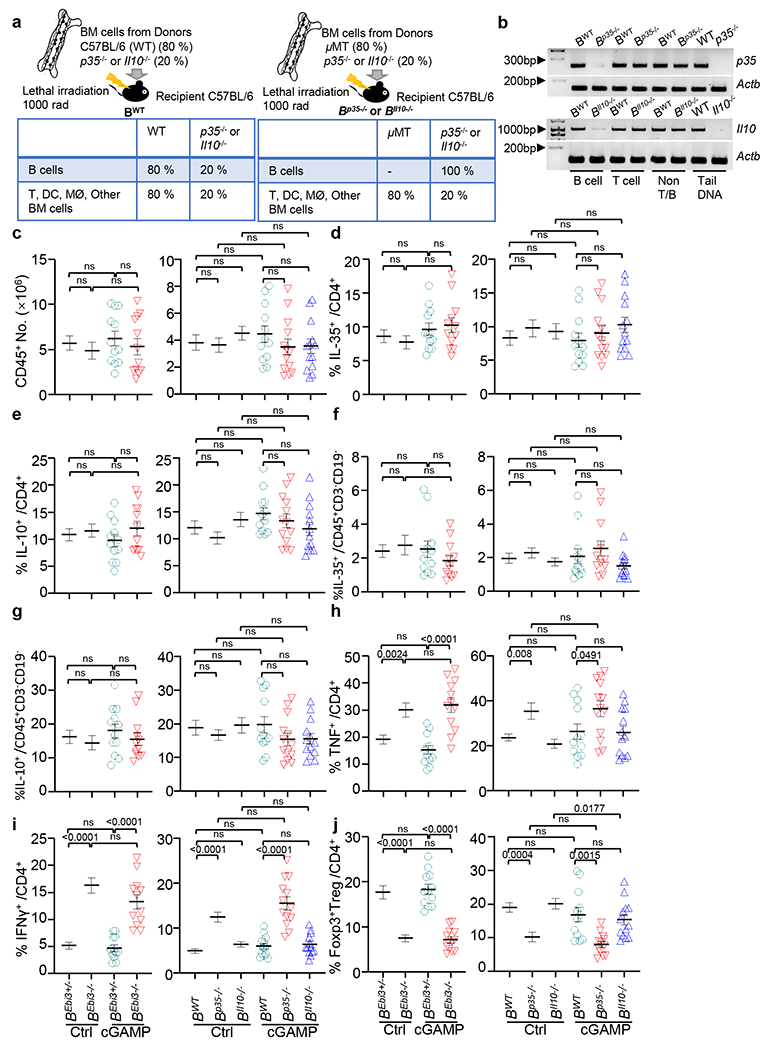
a, Mixed bone marrow chimeras containing B cell–specific deletion of p35 (B(p35−/−)) or Il10 (B(Il10−/−)) with WT (B(WT)) controls were generated (top) with expected cell phenotypes shown (bottom). b, Validation of loss of p35 and Il10 in B cells from B(p35−/−) and B(Il10−/−) mice. Genomic DNA was isolated from CD19+ B cells, CD3+ T cells and CD19−, CD3− cells (non-T or B cells). Genomic DNA samples from tails of WT, p35−/− and Il10−/− mice were used as controls. Actb was used as the internal control. c, Number of total tumoral CD45+ leukocytes from KPC4662 bearing cGAMP− and control PBS-treated mice as in Fig. 3c. d, Frequency of tumoral IL-35 producing CD4+ T cells from mice as in Fig. 3c. e, Frequency of tumoral IL-10 producing CD4+ T cells from mice as in Fig. 3c. f, Frequency of tumoral IL-35 producing non-T, B cells from mice as in Fig. 3c. g, Frequency of tumoral IL-10 producing non-T, B cells from mice as in Fig. 3c. h, Frequency of tumoral TNF secreting CD4+ T cells from mice as in Fig. 3c. i, Frequency of tumoral IFNγ secreting CD4+ T cells from mice as in Fig. 3c. j, Frequency of tumoral CD4+Foxp3+ Treg cells from mice as in Fig. 3c. Samples analyzed in Extended Data Fig. 4c–j are described in Fig. 3a,b. Representative experiments (Extended Data Fig. 4b) or a combination of three independent experiments (Extended Data Fig. 4c–j) are shown, with each symbol representing an individual animal and mean ± s.e.m. denoted. Unpaired two-tailed Student’s t tests were performed (Extended Data Fig. 4c–j) for statistical analysis. P values indicated; ns, not significant.