
Fig 1. The relative abundance of bacterial OTUs and genera in HM samples.
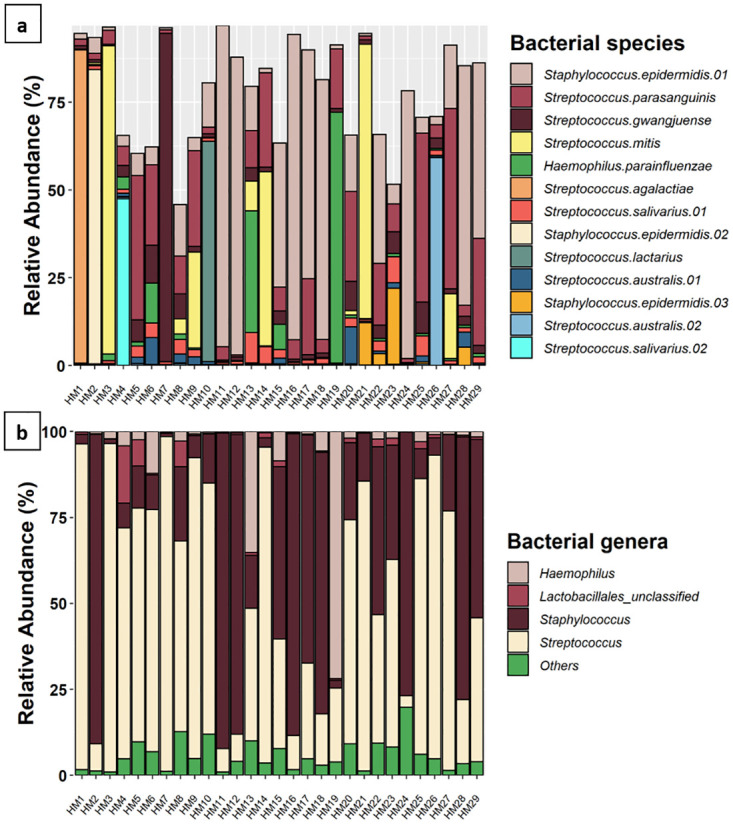
(a) The relative abundance of OTUs which made up ≥1% overall relative abundance. Species assigned to each OTU are noted in the legend. Where multiple OTUs mapped to the same species, they are numbered. (b) The relative abundance of bacterial genera which made up ≥ 1% relative abundance across all samples. Genera which accounted for < 1% relative abundance are grouped together as “others”.