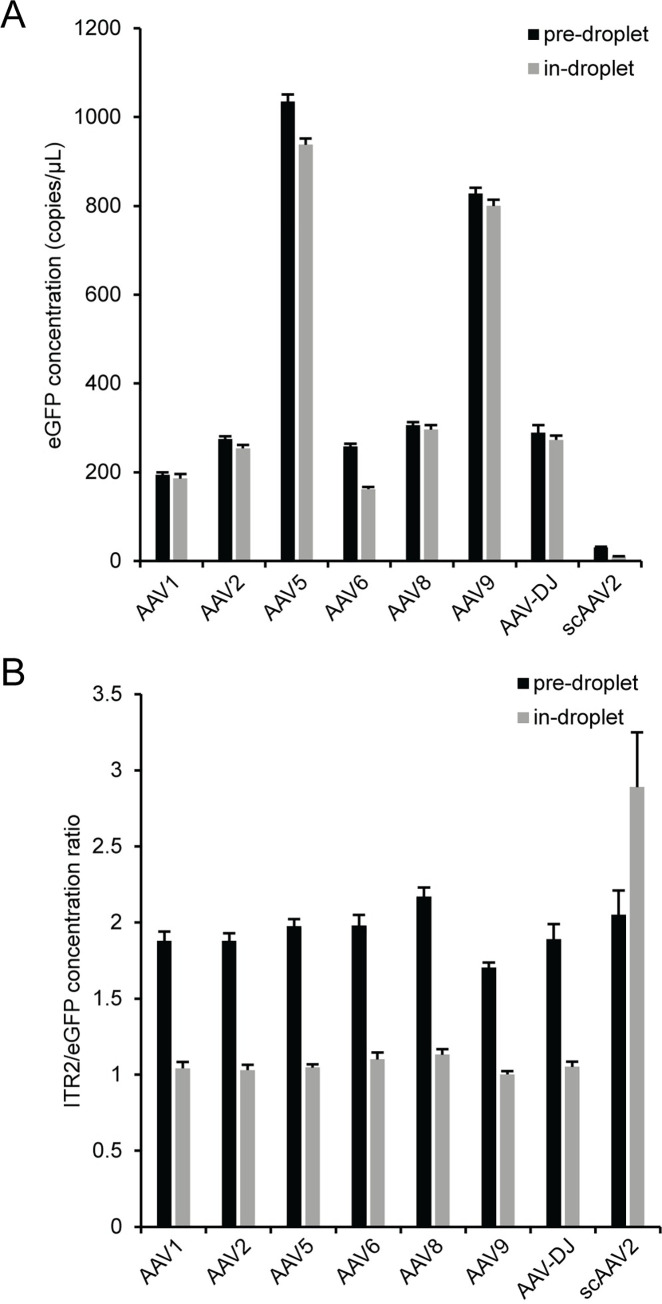
Fig 6. Comparison of pre-droplet and in-droplet capsid lysis.
After DNase I digestion, viruses were serially diluted using polyA+ buffer into the ddPCR concentration range. The viral samples were either lysed at 95°C for 10 min (pre-droplet) or added directly (in-droplet) to ddPCR reactions and lysed using the polymerase activation step of the PCR thermal cycle. The (A) eGFP concentration and (B) ITR2/eGFP concentration ratio. The error bars represent the 95% confidence interval.

