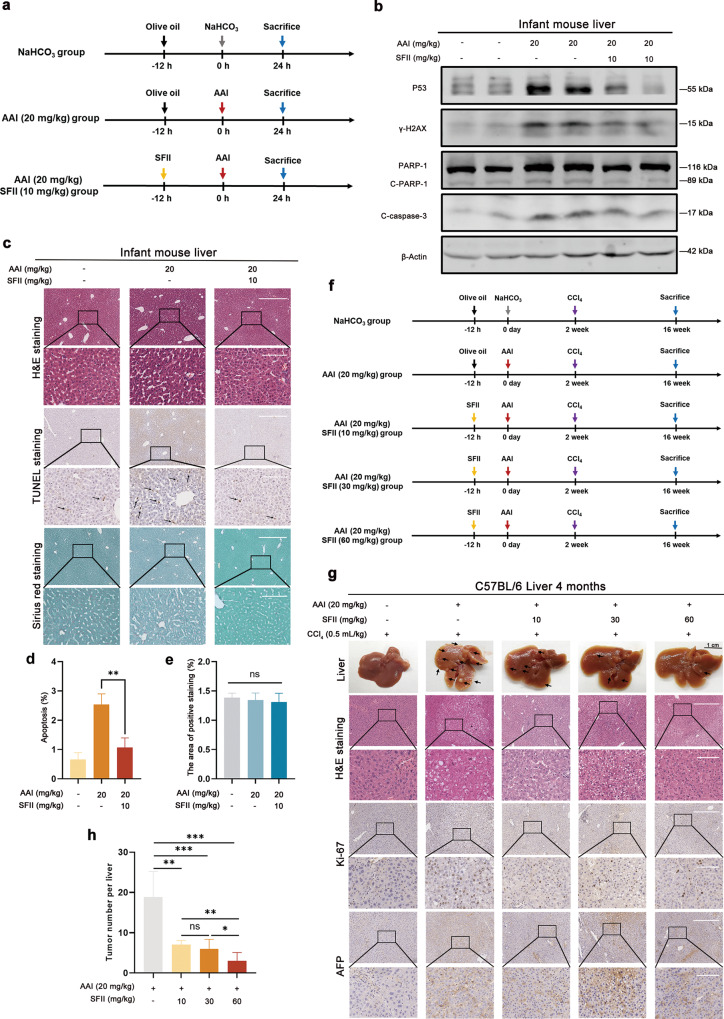
Fig. 6. The protective and anticancer effect of SFII in the liver of infant mice.
a Schematic representation of the short-term observation of AAI and SFII administration in infant mice. At 14 days of birth, mice were injected with NaHCO3 (gray arrow) or AAI (red arrow). The NaHCO3 group or AAI group were also pretreated with olive oil (black arrow, i.p.) 12 h before NaHCO3 or AAI administration. In the SFII treatment group, the mice were injected with SFII (orange arrow) 12 h before injection of AAI. b Western blot to detect the AAI-induced liver injury in infant mice treated with or without SFII. c Representative images of H&E staining (scale bars, 500 or 100 μm), TUNEL staining (scale bars, 500 or 100 μm), and Sirius red staining (scale bars, 500 or 100 μm) of the liver samples in infant mice treated with or without SFII. The black arrows point to apoptosis cells in the liver. d The percentage of hepatocyte apoptosis was calculated. e The staining area of liver fibrosis was calculated. f Schematic representation of the regimens of AAI and SFII administration in liver cancer model. At 14 days of birth, mice were injected with a single dose of NaHCO3 (gray arrow) or AAI (red arrow). The NaHCO3 group or AAI group were pretreated with oral olive oil (black arrow) 12 h before NaHCO3 or AAI administration. The mice were pretreated with oral SFII (orange arrow) 12 h before a single injection of AAI (red arrow) in the SFII treatment group. CCl4 was administered (i.p.) 2 weeks after the first shot of AAI for 14 weeks (once per week). g The representative pictures of gross (scale bars, 1 cm), H&E staining (scale bars, 500 or 100 μm), Ki-67 staining (scale bars, 500 or 100 μm), and AFP staining (scale bars, 500 or 100 μm) of the liver samples of mice after 16 weeks of AAI administration were presented. The black arrows point to the tumor in the liver. h The tumor number per liver in different treatment groups was calculated. *P < 0.05, **P < 0.01, ***P < 0.001.

