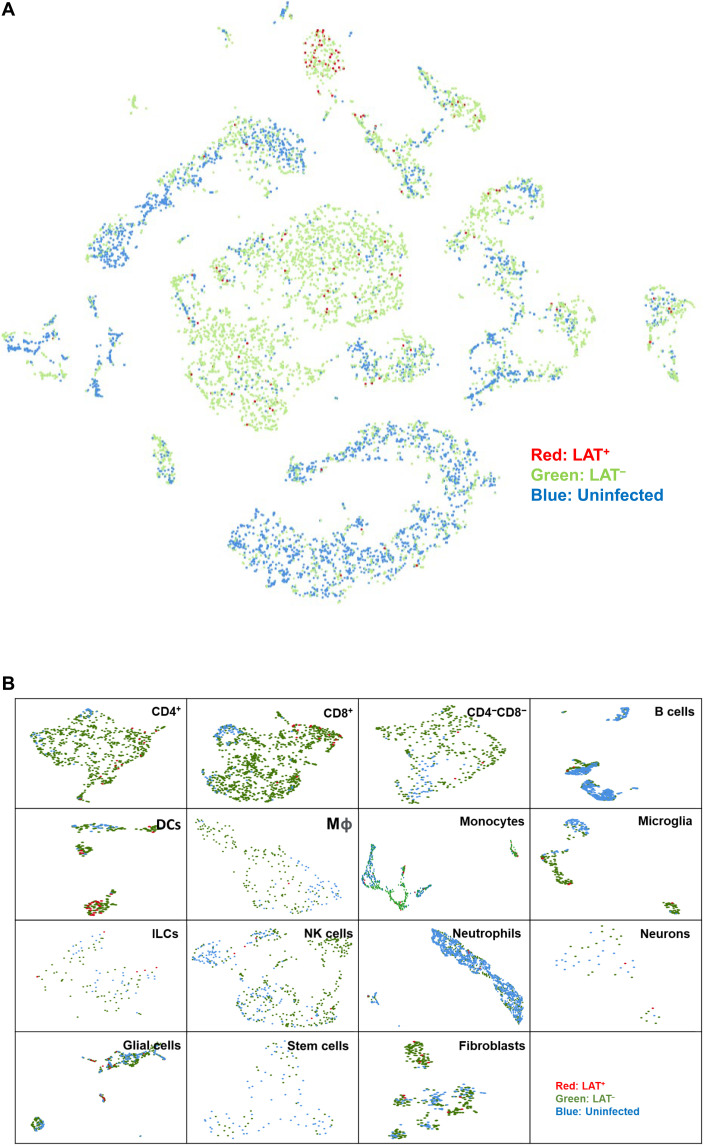
Fig. 3. Detection of LAT+ cells in TG of latently infected mice.
(A) Aggregated tSNE map of single-cell sequencing from uninfected (blue), infected (green), or LAT+ cells (red). As described in Fig. 2 legend, the aggregated cell separation map was created by Loupe to visualize LAT+ cells. Cells expressing LAT (expression level greater than 1) were marked as red. (B) Individual UMAP of each cell type containing LAT. Each cell type was divided into three groups according to infection status or LAT expression status (greater than 1). Red, infected and LAT+; green, infected and LAT−; and blue, uninfected and LAT−.

