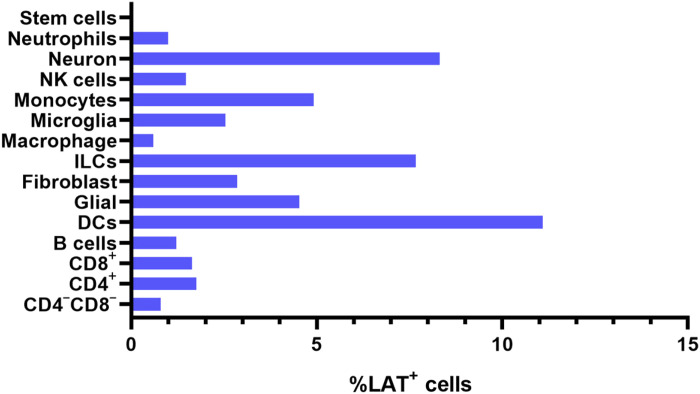
Fig. 4. Percentage of LAT+ cells in different cell populations.
The percentage of LAT+ cells in different infected cell populations are shown. In addition, number of LAT+/total cells for CD4−CD8− T cells, 3 of 372; CD4+ T cells, 13 of 737; CD8+ T cells, 17 of 1029; B cells, 5 of 408; DCs, 24 of 216; glial cells, 26 of 572; fibroblasts, 9 of 214; ILCs, 6 of 78; macrophages, 1 of 164; microglia, 5 of 196; monocytes, 17 of 345; NK cells, 5 of 337; neurons, 2 of 24; and neutrophils, 5 of 498.

