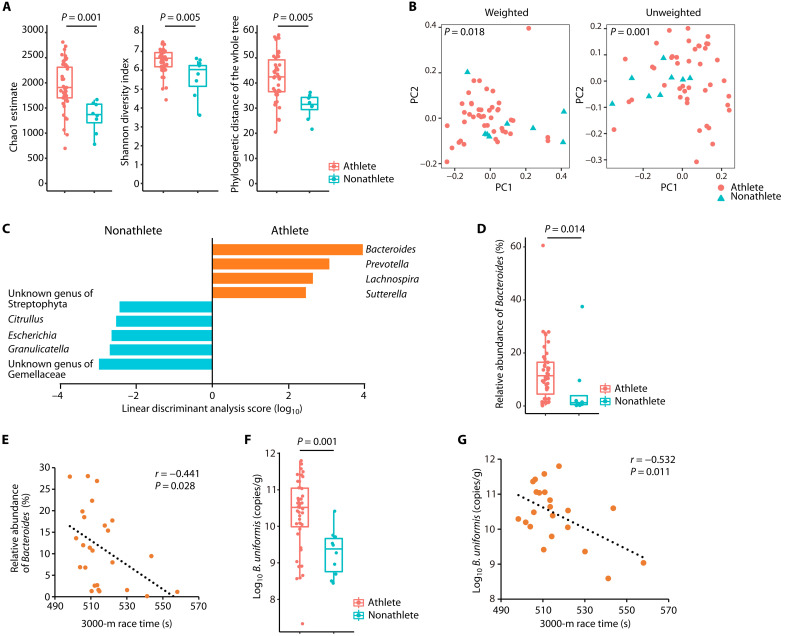
Fig. 1. Bacteroides abundance was higher in long-distance runners and correlated with the 3000-m race time.
(A) Gut microbiota α-diversity of long-distance male runners (athletes) and nonathlete male controls (nonathletes). The statistical significance of the differences between groups was analyzed using a two-sample t test with Monte Carlo permutations. (B) Fecal microbiota profiles of athletes (red circles) and nonathletes (blue triangles). Principal coordinate analysis plots using weighted or unweighted UniFrac distances are shown. The statistical significance of the differences between groups was analyzed using permutational multivariate analysis of variance (PERMANOVA). (C) LEfSe analysis was performed to isolate genera with | Linear discriminant analysis score | > 2. (D) Relative abundance of the genus Bacteroides in the athlete and nonathlete groups, determined by 16S rRNA-encoding gene amplicon sequencing and compared using the Mann-Whitney U test. (E) Scatterplot of the 3000-m race time and the relative abundance of Bacteroides in the athlete group. Individual participants are represented as circles. (F) B. uniformis abundance in feces collected from the athlete and nonathlete groups, determined by 16S rRNA-encoding gene copy numbers using B. uniformis–specific qPCR. The Mann-Whitney U test was used to compare the groups. (G) Scatterplot of the 3000-m race time and B. uniformis abundance in the athlete group. Individual participants are represented as circles. The distribution of values within each group (A, D, and F) is illustrated by a box-and-whisker plot. (A to D) Athlete group, n = 43; nonathlete group, n = 8. (F) Athlete group, n = 48; nonathlete group, n = 10. (E and G) Athlete group, n = 25. Twenty-three of 48 athletes refused to participate in the trial to measure the race time. All statistical tests were two-tailed. For correlations, the dotted line shows the regression line.

