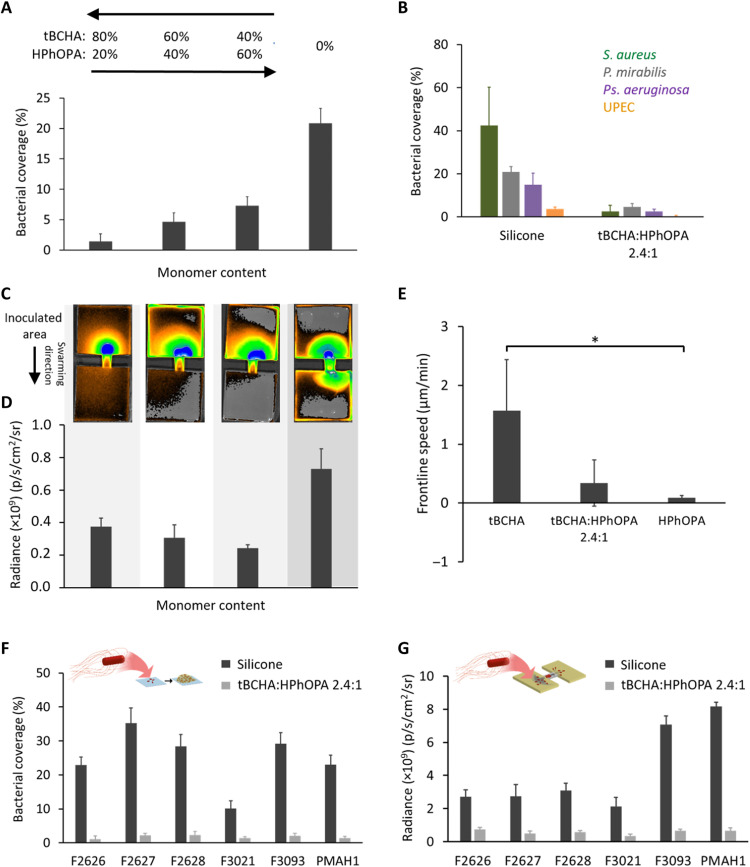
Fig. 4. Biofilm and swarming resistance of tBCHA:HPhOPA copolymers.
(A) Proteus biofilm surface coverage on the tBCHA:HPhOPA copolymer series compared with silicone (0%). (B) S. aureus SH1000 (dark green), P. mirabilis (gray), Ps. aeruginosa PAO1 (purple), and E. coli (orange) surface coverage on silicone compared with tBCHA:HPhOPA 2.4:1. (C) Fluorescence images of the Proteus catheter bridge swarming assays for the copolymer series and uncoated silicone. (D) Quantification of the corresponding fluorescence images for the lower agar block following swarming migration. (E) Frontline swarming speed of Proteus observed on coatings of tBCHA, HPhOPA, and tBCHA:HPhOPA 2.4:1. Error bars are ± 1 SD unit for at least three independent replicates. *P < 0.05. Significance was determined by one-way ANOVA analysis using Tukey’s multiple comparisons test. (F) Schematic depiction of biofilm assay and bacterial surface coverage determined for uncoated silicone or the copolymer with six dsRed-labeled P. mirabilis clinical isolates. (G) Schematic depiction of swarming assay and fluorescence determined at the surface of the lower block following swarming migration of the P. mirabilis clinical isolates across either silicone or the tBCHA:HPhOPA 2.4:1 copolymer. For experiments in (F) and (G), SD values are based on the mean value of three biological replicates.

