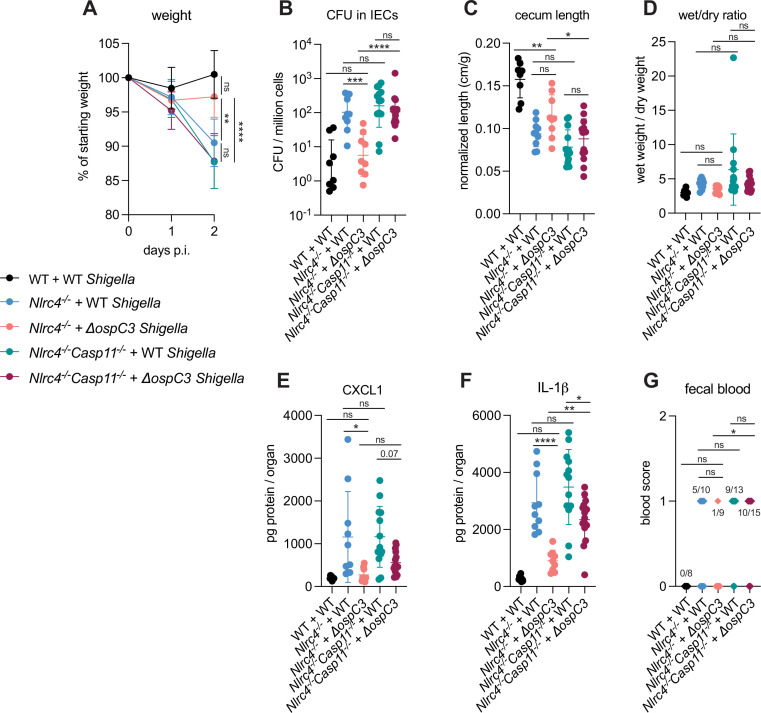
Figure 4. OspC3-driven virulence in B6.Nlrc4–/– mice depends on Caspase-11.
(A–G) Mice were treated orally with 25 mg streptomycin sulfate in water and then infected 1 day later. B6.WT mice were orally challenged with 107 colony forming units (CFUs) of wild-type (WT) Shigella flexneri (black, n=8), B6.Nlrc4–/– (co-housed B6.Nlrc4–/–Casp11+/+ and B6.Nlrc4–/–Casp11+/–) mice were challenged with WT (blue, n=10) or ΔospC3 S. flexneri (pink, n=9), and B6.Nlrc4–/–Casp11–/– mice (littermates with the B6.Nlrc4–/–Casp11+/–) were challenged with WT (teal, n=13) or ΔospC3 S. flexneri (maroon, n=15). Mice were littermates or were co-housed for 3 weeks prior to infection and were sacrificed at 2 days post-infection. (A) Mouse weights from 0 through 2 days post-infection. Each symbol represents the mean for all mice of the indicated group. (B) Shigella CFUs per million cells from the combined intestinal epithelial cell (IEC) enriched fraction of gentamicin-treated cecum and colon tissue. (C) Quantification of cecum lengths normalized to mouse weight prior to infection; cecum length (cm)/mouse weight (g). (D) The ratio of fecal pellet weight when wet (fresh) divided by the fecal pellet weight after overnight drying. Pellets were collected at day 2 post-infection. (E, F) CXCL1 and IL-1β levels measured by ELISA from homogenized cecum and colon tissue of infected mice. (G) Blood scores from feces collected at 2 days post-infection. 1=occult blood, 2=macroscopic blood. (B–G) Each symbol represents one mouse. Data collected from two independent experiments. Mean ± SD is shown in (A, C–F). Geometric mean ± SD is shown in (B). Statistical significance was calculated by one-way ANOVA with Tukey’s multiple comparison test (A (day 2), B–F) and by Fisher’s exact test in (G) where data were stratified by presence (score = 1 or 2) or absence (score = 0) of blood. Data were log-transformed prior to calculations in (B, D) to achieve normality. *p<0.05, **p<0.01, ***p<0.001, ****p<0.0001, ns = not significant (p>0.05).

