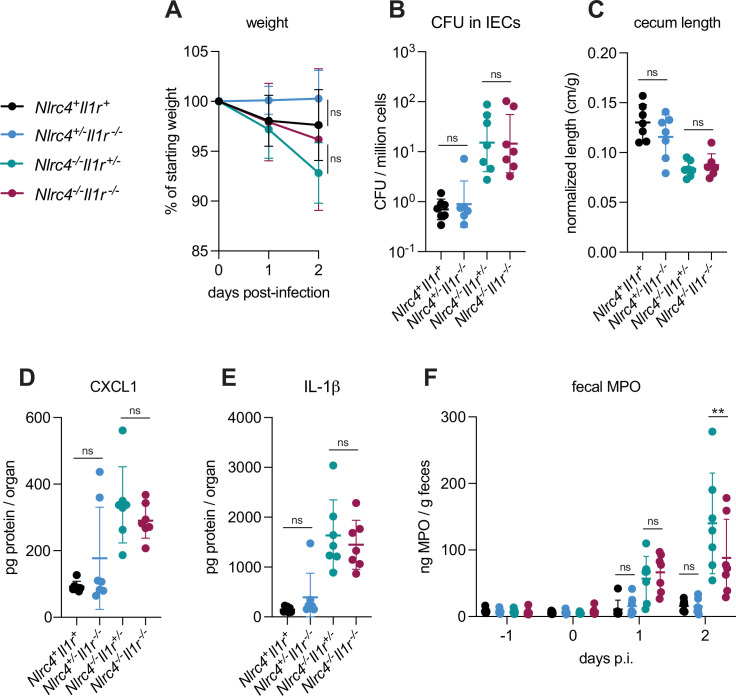
Figure 6. IL-1 signaling does not affect Shigella pathogenesis.
(A–F) Nlrc4+Il1r1+mice (co-housed B6.WT and Nlrc4+/–Il1r1+/–, black, n=7), Nlrc4+/–Il1r1–/– (blue, n=7), Nlrc4–/–Il1r1+/– (teal, n=7), and Nlrc4–/–Il1r1–/– (maroon, n=7) littermates were treated orally with 25 mg streptomycin sulfate in water and orally challenged the next day with 107 colony forming units (CFUs) of wild-type (WT) Shigella flexneri. Mice were sacrificed at 2 days post-infection. (A) Mouse weights from 0 through 2 days post-infection. Each symbol represents the mean for all mice of the indicated group. (B) Shigella CFUs per million cells from the combined intestinal epithelial cell (IEC) enriched fraction of gentamicin-treated cecum and colon tissue. (C) Quantification of cecum lengths normalized to mouse weight prior to infection; cecum length (cm)/mouse weight (g). (D, E) CXCL1 and IL-1β levels measured by ELISA from homogenized cecum and colon tissue of infected mice. (F) Myeloperoxidase enzyme levels in mouse feces collected each day prior to and during infection and measured by ELISA. (B–F) Each symbol represents one mouse. Data were collected from one experiment but are representative of two independent experiments. Mean ± SD is shown in (A, C–F). Geometric mean ± SD is shown in (B). Statistical significance was calculated by one-way ANOVA with Tukey’s multiple comparison test (A (day 2), B–E) and two-way ANOVA with Tukey’s multiple comparison test (F). Data were log-transformed prior to calculations in (B) to achieve normality. *p<0.05, **p<0.01, ***p<0.001, ****p<0.0001, ns = not significant (p>0.05).

