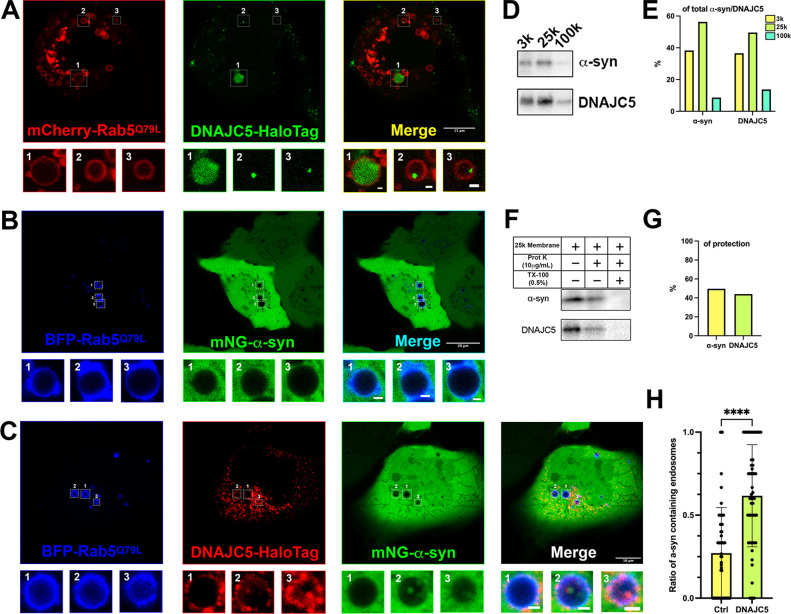
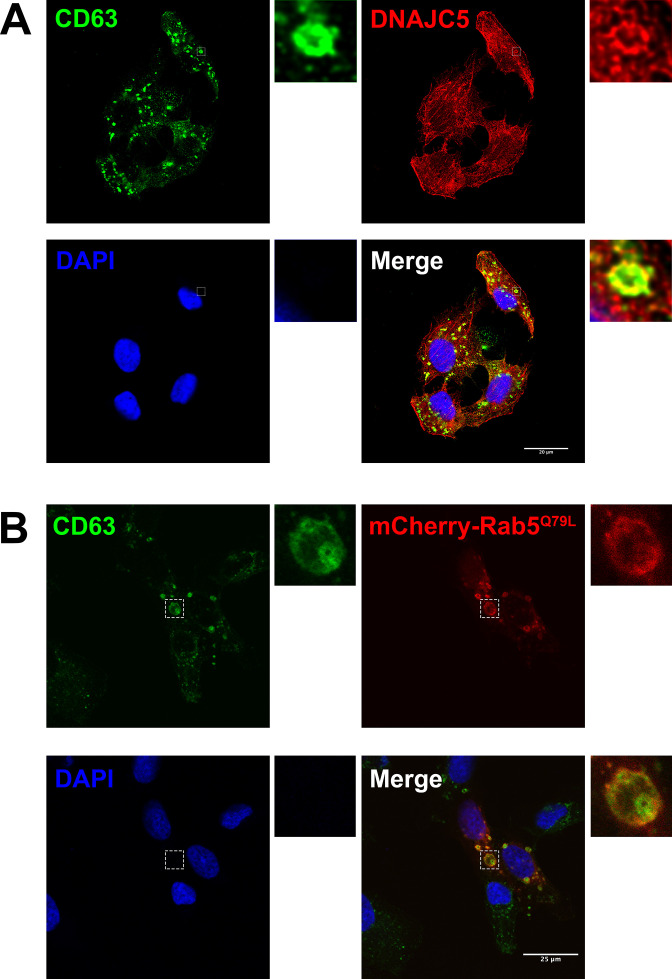
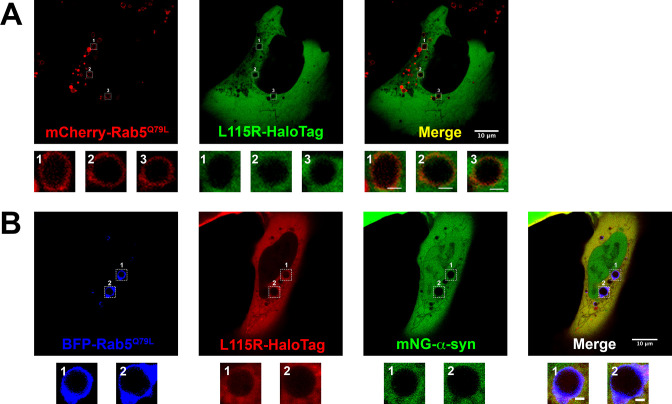
Figure 4. Topological localization of α-syn and DNAJC5 in enlarged endosomes.
(A) DNAJC5 was internalized inside enlarged endosomes. Live U2OS cells expressing mCherry-Rab5Q79L (red) showed circular enlarged endosomes labeled by Rab5 mutant. DNAJC5-HaloTag (green) was visualized by addition of HaloTag Oregon Green Ligand. Representative enlarged endosomes show diffuse (1) or punctate (2 and 3) internalized DNAJC5. Scale bar: 15 μm in overviews and 1 μm in magnified insets. (B) α-syn was excluded from enlarged endosomes. In live U2OS cells, expression of BFP-Rab5Q79L (blue) produced enlarged endosomes of similar morphology compared with mCherry-Rab5Q79L. mNeonGreen-α-syn (mNG-α-syn, green) was expressed both in the nucleus and cytosol. No mNG-α-syn was found inside enlarged endosomes (1–3). Scale bar: 20 μm in overviews and 1 μm in magnified insets. (C) α-syn enters into enlarged endosomes in the presence of DNAJC5. DNAJC5-HaloTag (red) and mNG-α-syn (green) were coexpressed in U2OS cells carrying BFP-Rab5Q79L (blue) mutant and imaged. No mNG-α-syn was internalized in endosome without DNAJC5-HaloTag inside (1). In contrast, mNG-α-syn was found inside endosomes with DNAJC5-HaloTag inside (2 and 3). Scale bar: 10 μm in overviews and 1 μm in magnified insets. (D) α-syn and DNAJC5 co-sedimented in membrane fractionation. HEK293T cell homogenate was sequentially centrifuged at increasing velocity from 3000×g (3k), 25,000×g (25k), and 100,000×g (100k). The 25k membrane fraction had the highest amount of both α-syn and DNAJC5. (E) Quantification of the membrane fractionation results in (D). (F) Proteinase K protection assay of 25k membrane-containing α-syn and DNAJC5. (G) Quantification of the proteinase K protection assay in (F). (H) Quantification of the ratio of α-syn-containing endosomes in control cells (no-DNAJC5 transfection) or cells co-transfected with DNAJC5. More than 100 enlarged endosomes were counted in each group. Error bars represent standard deviations. P value<0.0001, two-tailed t test.


