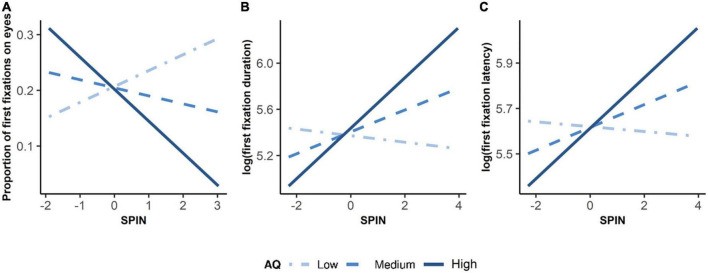
FIGURE 3.
Simple Slope Plots of Interaction between Autistic Traits and Social Anxiety on Initial Attention to the Eyes. Low autistic traits referred to –1 standard deviation below mean AQ. Medium autistic traits referred to mean AQ. High autistic traits referred to 1 standard deviation above mean AQ. X-axis was the z-standardized score of SPIN. Three plots show interactions between autistic traits and social anxiety on (A) proportion of first fixations on eyes, (B) log-transformed duration of first fixation, and (C) log-transformed latency of first fixation.

