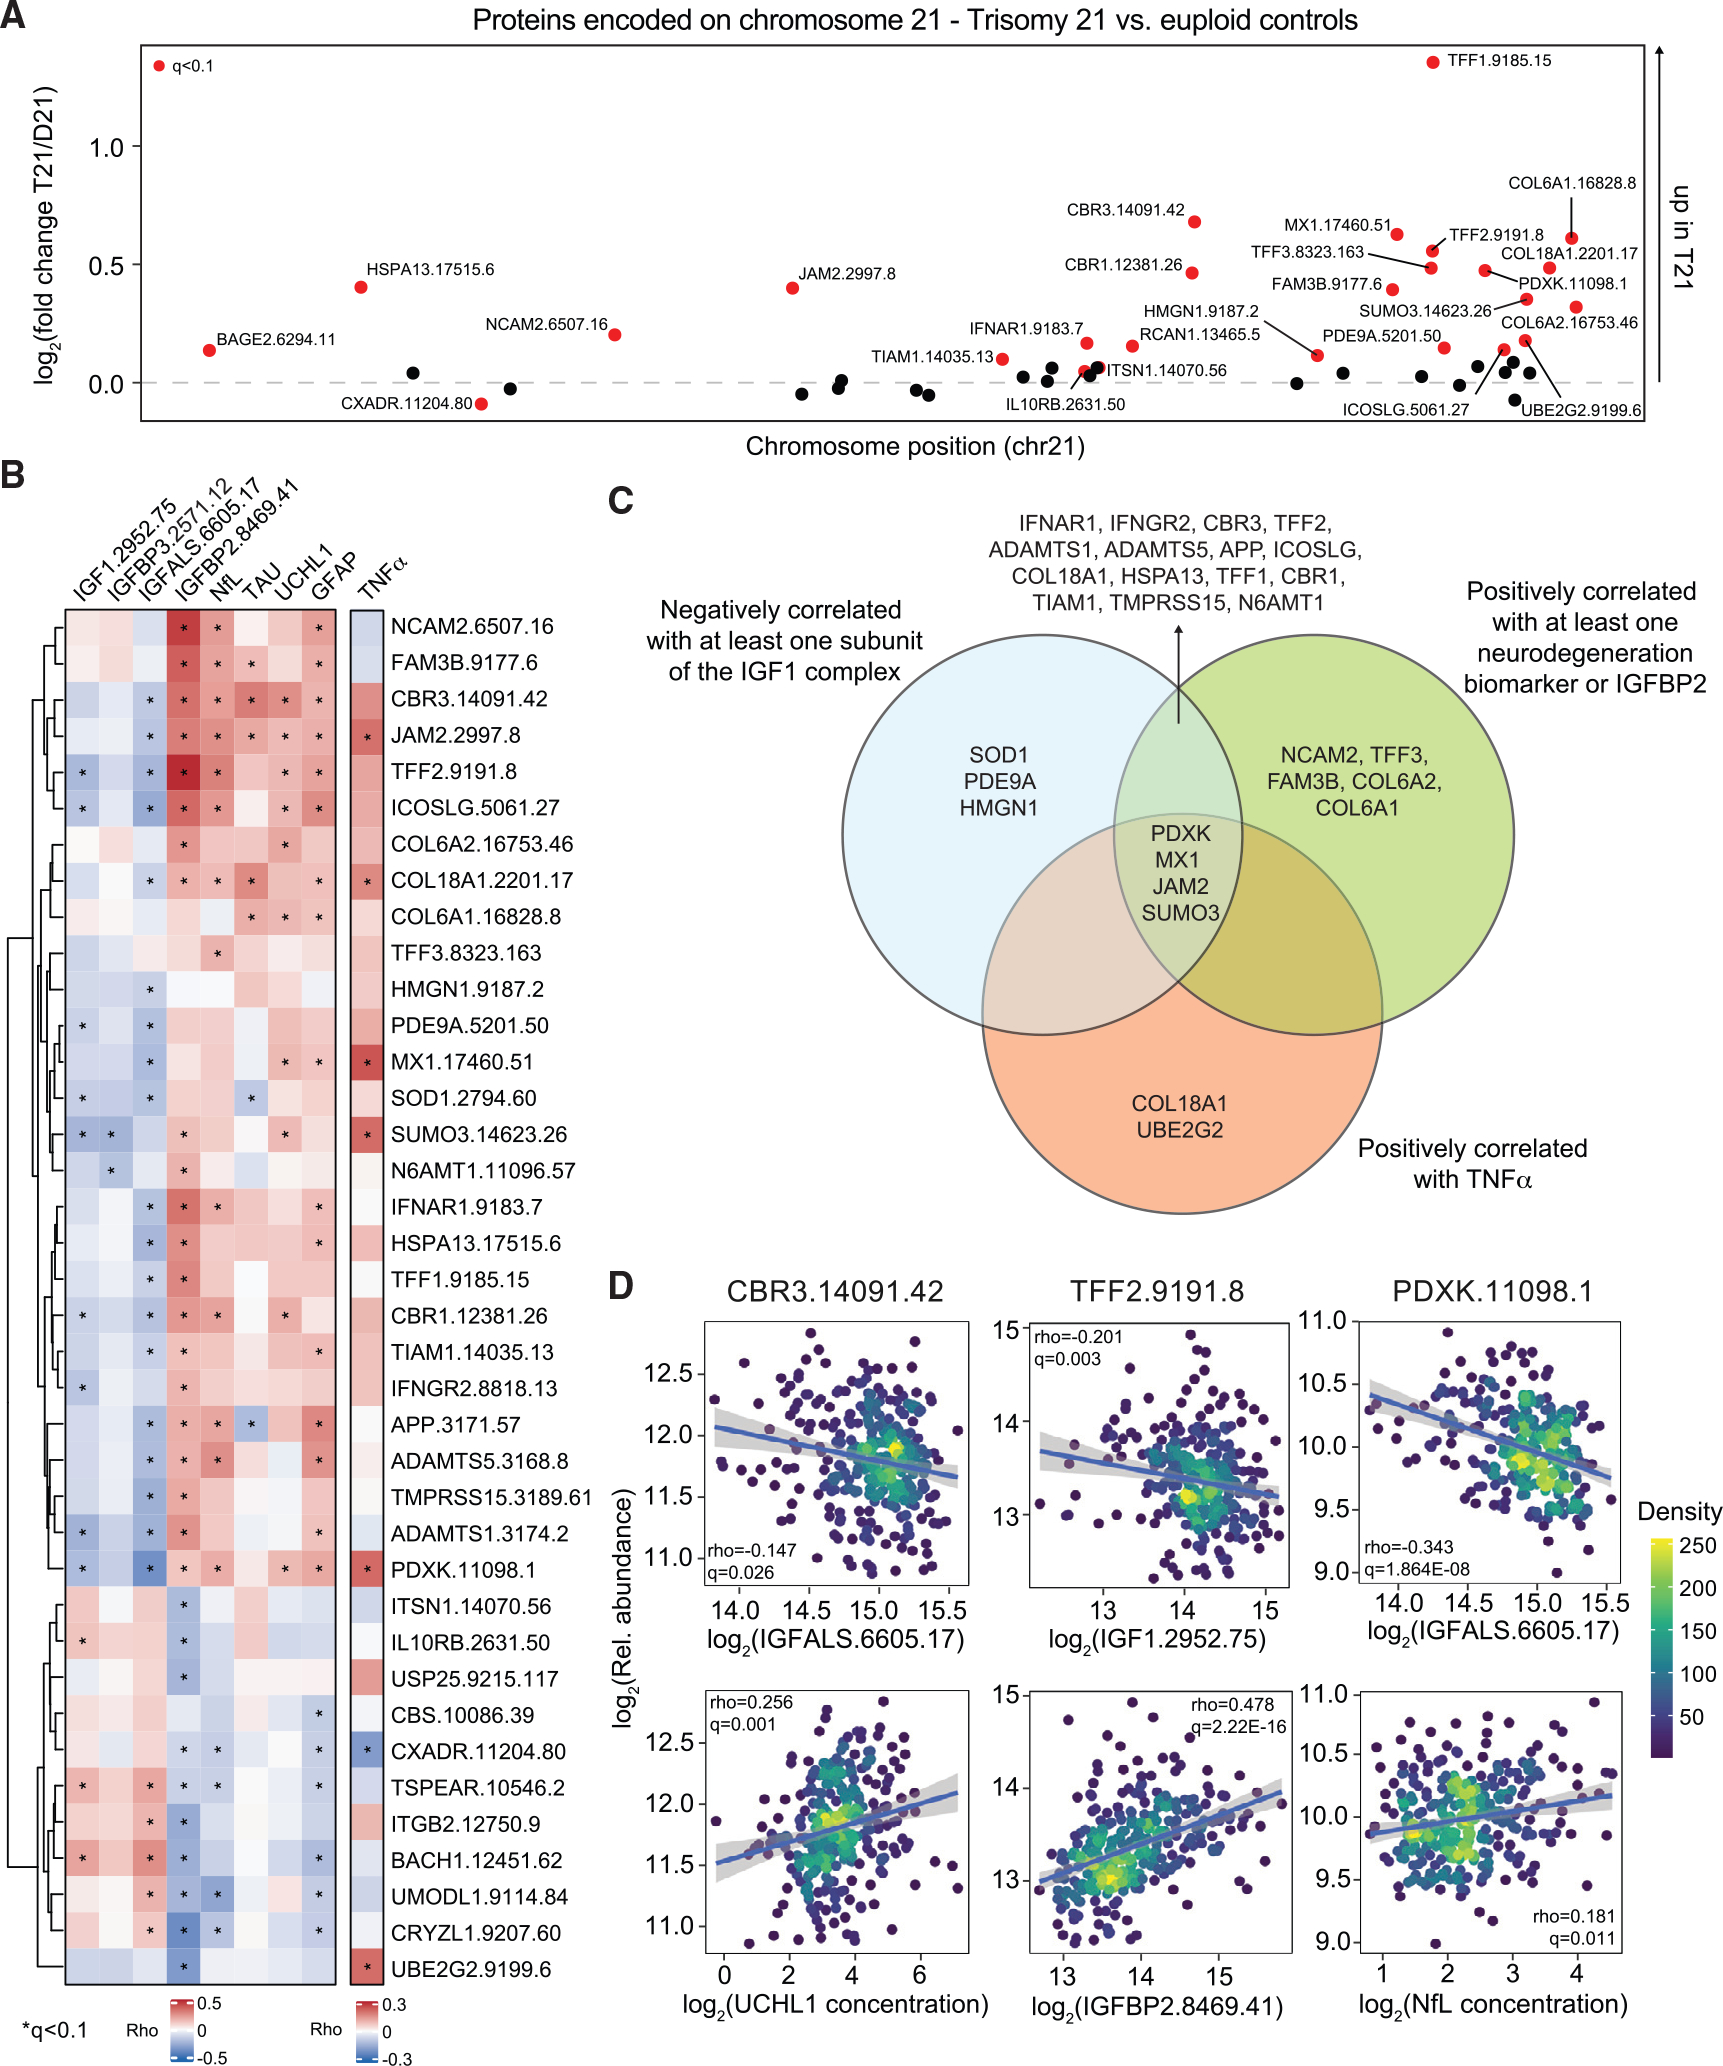
Figure 4. Interplay between overexpression of chr21 proteins, IGF1 deficiency, and elevated markers of neurodegeneration in DS.

Levels of proteins encoded on chromosome (chr21) were measured in plasma samples from 419 research participants, 316 of them with T21, versus 103 age- and sex-matched euploid controls (D21).
(A) Manhattan plot of chr21, displaying the results of proteomics analysis by karyotype as estimated by multivariable linear model for log2(fold change T21/D21) with adjustment for age, sex, and source as covariables. Proteins passing the statistical cutoff (q < 0.1) are highlighted in red.
(B) Heatmap indicating the proteins encoded on chr21 that are significantly correlated, positively or negatively, with the IGF1 ternary complex and IGFBP2 proteins, the four neurodegeneration/neuroinflammation biomarkers, and TNF-α, adjusted by age, sex, and source as covariables. Values displayed represent Spearman rho values.
(C) Venn diagram displaying the overlaps in proteins encoded on chr21 that are negatively or positively correlated with various factors as described in (B).
(D) Scatterplots displaying adjusted values for levels of select proteins encoded on chr21 (CBR3, TFF2, and PDXK) versus factors involved in IGF1 signaling and neurodegeneration/neuroinflammation biomarkers among individuals with T21. Values shown represent Spearman rho values and q values. Points are colored by density. Lines represent a simple linear regression with 95% confidence interval.
See also Figure S4 and Table S5.
