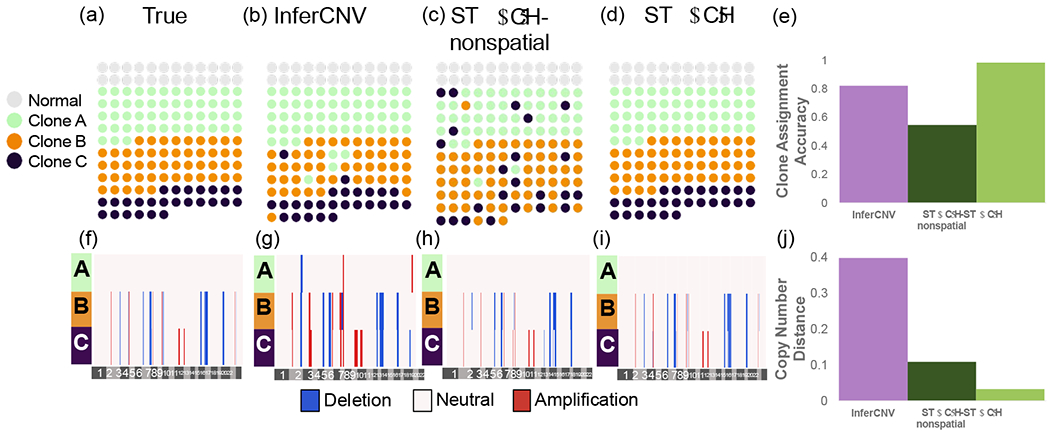
Figure 2:

Clone assignment and CNA inference results from InferCNV, STARCH-nonspatial, and STARCH on synthetic spatial transcriptomics data. (a) Simulated spatial structure for clones A (green), B (orange) and C (purple). Normal spots are indicated in gray. (b-d) Clone assignments inferred by each method. (e) Clone assignment accuracy for each method computed as the Adjusted Rand Index between true and inferred clone assignments (higher is better) (f-i). Inferred copy number profiles for each clone. (j) Copy number distance between true and inferred copy number profiles (lower is better).
